• Photonics Research
  • Vol. 9, Issue 5, 865 (2021)
Zhen Chen1, Qian Zhou1, Huitian Du1, Yuan Yu1, Chuang Zhang2, Shenghao Han1, and Zhiyong Pang1、*
Author Affiliations
  • 1School of Microelectronics, State Key Laboratory of Crystal Materials, Shandong University, Jinan 250100, China
  • 2Institute of Chemistry, Chinese Academy of Sciences, Beijing 100190, China
  • show less
    DOI: 10.1364/PRJ.412860 Cite this Article Set citation alerts
    Zhen Chen, Qian Zhou, Huitian Du, Yuan Yu, Chuang Zhang, Shenghao Han, Zhiyong Pang. Immensely enhanced color-adjustable upconversion fluorescence in electron donor-acceptor exciplex chromophores doped with fluorescent emitters[J]. Photonics Research, 2021, 9(5): 865 Copy Citation Text show less
    (a) Molecular structures of the donor TAPC and the acceptor 3TPYMB. (b) Energy diagram of TAPC and 3TPYMB, and scheme of exciplex formation. (c) Normalized optical absorption spectra and PL spectra of TAPC, 3TPYMB, and TAPC:3TPYMB blend (1:1). (d) Room temperature photoluminescence decay curve of TAPC and 3TPYMB. (e) Room temperature PL decay curve of TAPC:3TPYMB blend (1:1).
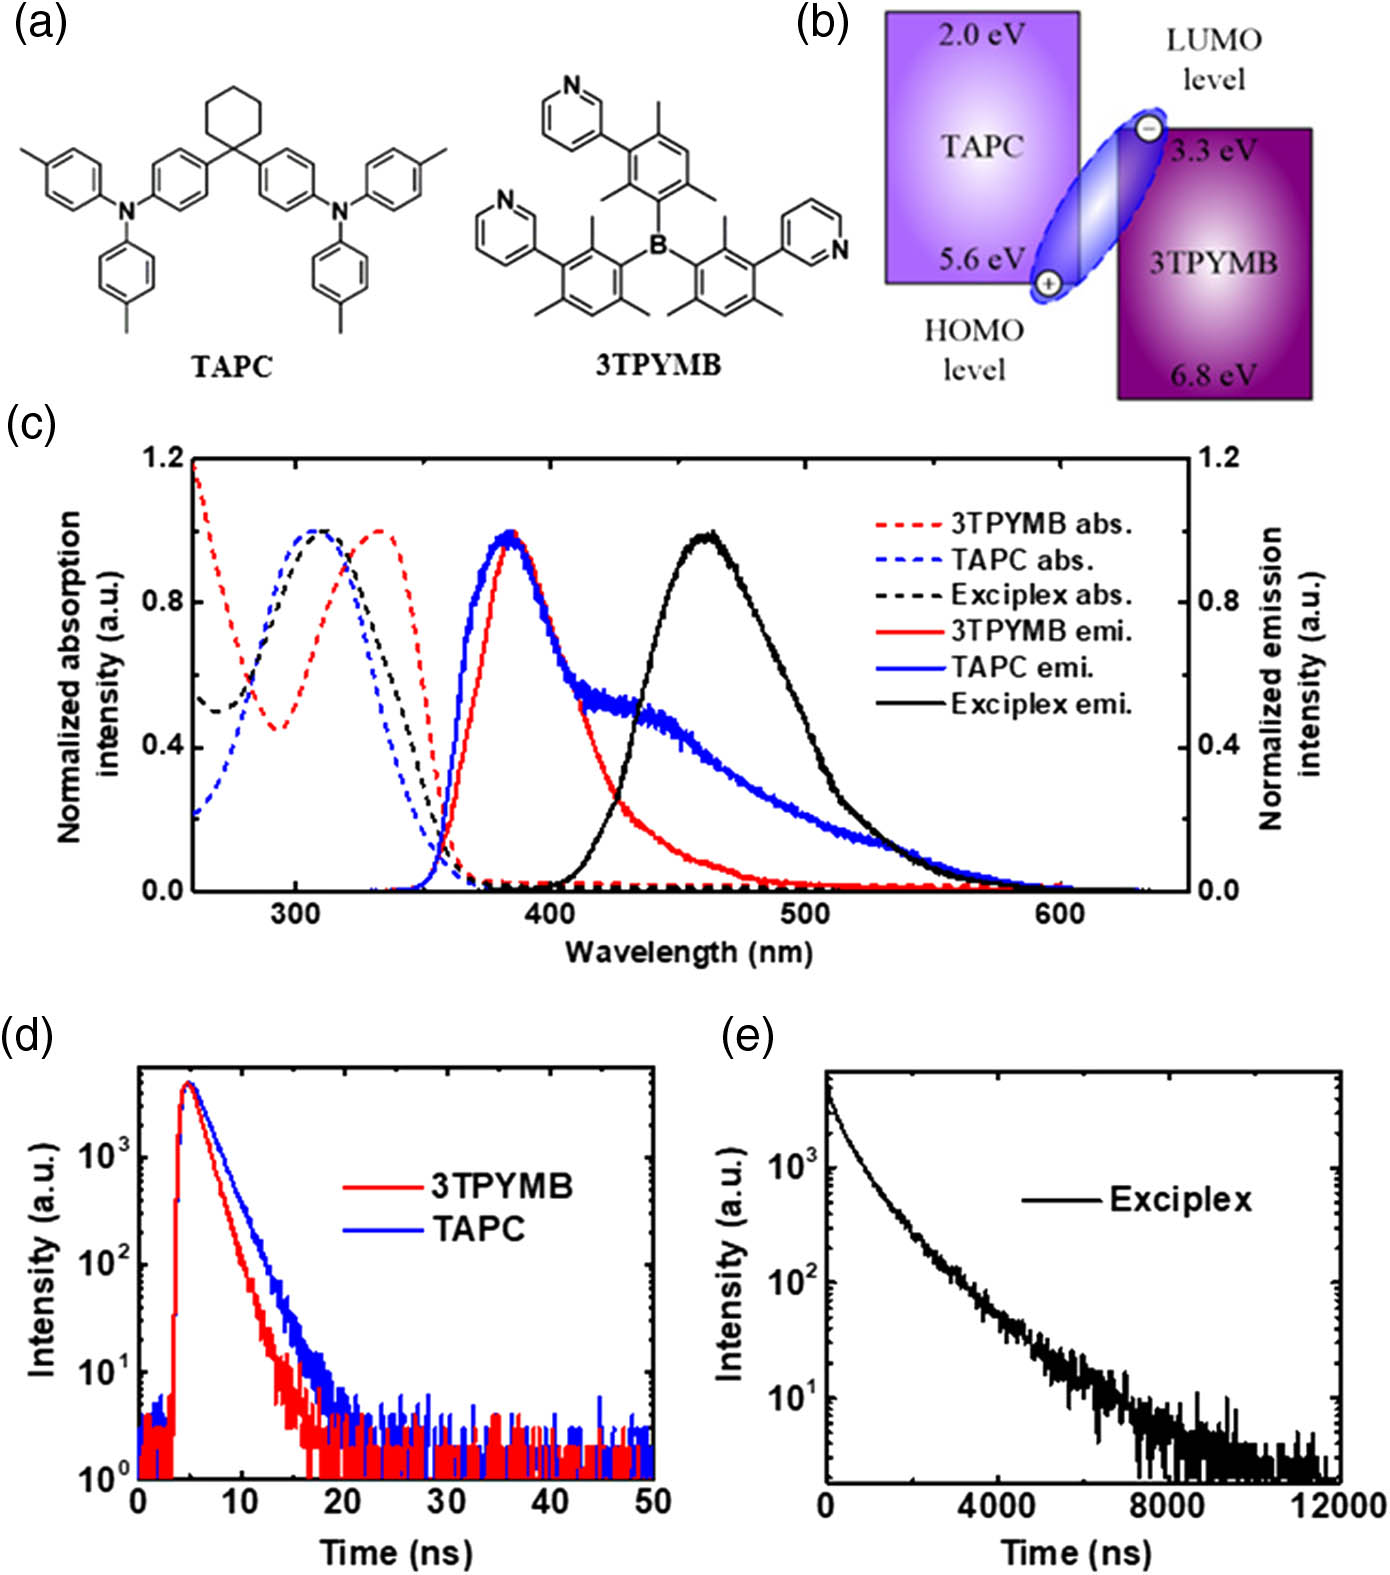
    Fig. 1. (a) Molecular structures of the donor TAPC and the acceptor 3TPYMB. (b) Energy diagram of TAPC and 3TPYMB, and scheme of exciplex formation. (c) Normalized optical absorption spectra and PL spectra of TAPC, 3TPYMB, and TAPC:3TPYMB blend (1:1). (d) Room temperature photoluminescence decay curve of TAPC and 3TPYMB. (e) Room temperature PL decay curve of TAPC:3TPYMB blend (1:1).
    (a) Schematic diagram of the one-/two-photon excited fluorescence process in conventional exciton-type molecules. (b) Schematic of the fluorescence enhancement from the TADF process. TPA, two-photon absorption; 1D*, singlet state of donor; 1EX, singlet states of DA exciplex; 3EX, triplet states of DA exciplex; ISC, intersystem crossing; RISC, reverse intersystem crossing; PF, prompt fluorescence; DF, delayed fluorescence; and NR: nonradiative transition.
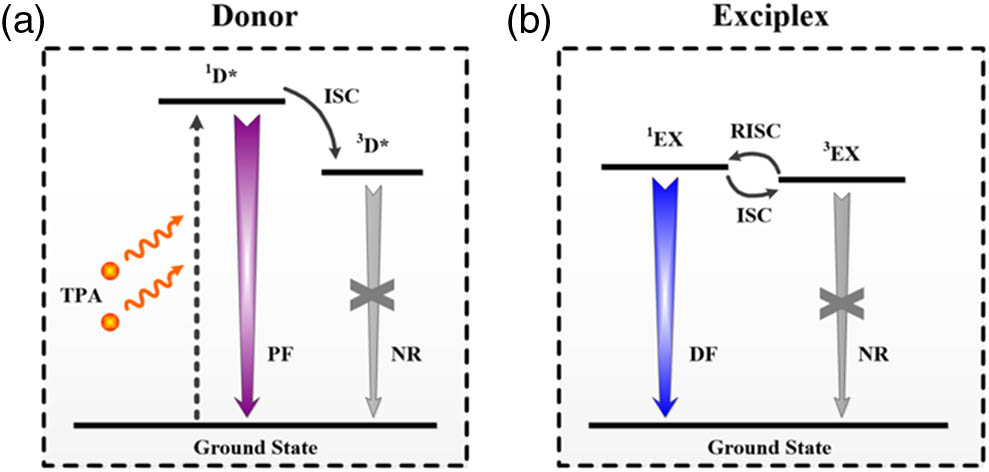
    Fig. 2. (a) Schematic diagram of the one-/two-photon excited fluorescence process in conventional exciton-type molecules. (b) Schematic of the fluorescence enhancement from the TADF process. TPA, two-photon absorption; 1D*, singlet state of donor; 1EX, singlet states of DA exciplex; 3EX, triplet states of DA exciplex; ISC, intersystem crossing; RISC, reverse intersystem crossing; PF, prompt fluorescence; DF, delayed fluorescence; and NR: nonradiative transition.
    (a) Upconversion PL spectra of TAPC:3TPYMB blend (1:1) under 760 nm excitation at different powers. (b) Log-log plot of the integrated area of PL spectra versus the power intensities of input laser by using the data of (a). (c) Two-photon excited fluorescence spectra of TAPC, 3TPYMB, and TAPC:3TPYMB blend (1:1) under 760 nm excitation at the same condition. Three spectra were measured in different areas for each sample. (d) Comparison of average integrated area of PL spectra using the corresponding data of (c).
    Fig. 3. (a) Upconversion PL spectra of TAPC:3TPYMB blend (1:1) under 760 nm excitation at different powers. (b) Log-log plot of the integrated area of PL spectra versus the power intensities of input laser by using the data of (a). (c) Two-photon excited fluorescence spectra of TAPC, 3TPYMB, and TAPC:3TPYMB blend (1:1) under 760 nm excitation at the same condition. Three spectra were measured in different areas for each sample. (d) Comparison of average integrated area of PL spectra using the corresponding data of (c).
    (a) Molecular structures of emitter dopants TTPA and DCM. (b) Normalized room temperature optical absorption and PL spectra of emitter dopants TTPA and DCM. The dark area shows the normalized PL emission band of the TAPC:3TPYMB (1:1) DA blend host. (c) Steady state PL spectra of TAPC:3TPYMB (1:1) blends doped with a TTPA emitter dopant at various concentrations. (d) Steady-state PL spectra of TAPC:3TPYMB (1:1) blends doped with DCM emitter dopant at various concentrations. (e) PL decay curves of 2% DCM- and TTPA-doped TAPC:3TPYMB (1:1) blends. (f) Electroluminescence spectrum of organic light-emitting devices based on exciplex doped with 2% TTPA. (Inset: device structure and photo image of the emission.)
    Fig. 4. (a) Molecular structures of emitter dopants TTPA and DCM. (b) Normalized room temperature optical absorption and PL spectra of emitter dopants TTPA and DCM. The dark area shows the normalized PL emission band of the TAPC:3TPYMB (1:1) DA blend host. (c) Steady state PL spectra of TAPC:3TPYMB (1:1) blends doped with a TTPA emitter dopant at various concentrations. (d) Steady-state PL spectra of TAPC:3TPYMB (1:1) blends doped with DCM emitter dopant at various concentrations. (e) PL decay curves of 2% DCM- and TTPA-doped TAPC:3TPYMB (1:1) blends. (f) Electroluminescence spectrum of organic light-emitting devices based on exciplex doped with 2% TTPA. (Inset: device structure and photo image of the emission.)
    Power-dependent, long-wavelength-excited fluorescence spectra of TAPC:3TPYMB (1:1) blends doped with (a) 2% TTPA and (b) 2% DCM. (c) Log–log plot of the integrated area of PL spectra versus the power intensity of input laser by using the data of (a). (d) Log–log plot of the integrated area of PL spectra versus the power intensity of input laser by using the data of (b).
    Fig. 5. Power-dependent, long-wavelength-excited fluorescence spectra of TAPC:3TPYMB (1:1) blends doped with (a) 2% TTPA and (b) 2% DCM. (c) Log–log plot of the integrated area of PL spectra versus the power intensity of input laser by using the data of (a). (d) Log–log plot of the integrated area of PL spectra versus the power intensity of input laser by using the data of (b).
    (a) Normalized long-wavelength-excited fluorescence spectra of pristine A, undoped DA blend, TTPA-doped DA blend, and DCM-doped DA blend. (b) Two-photon excited fluorescence spectra of undoped- and 2% TTPA-doped TAPC:3TPYMB blend (1:1) measured at the same condition. (Three curves with the same color indicate that the same sample has been measured three times.) (c) Two-photon excited fluorescence spectra of undoped- and 2% DCM-doped TAPC:3TPYMB blend (1:1) measured at the same condition. For (b) and (c), three spectra were measured on different areas for each sample. All the spectra were measured without a convergent lens. (d) Schematics of the two-photon excited fluorescence process in fluorescence emitter-doped TADF DA exciplex.
    Fig. 6. (a) Normalized long-wavelength-excited fluorescence spectra of pristine A, undoped DA blend, TTPA-doped DA blend, and DCM-doped DA blend. (b) Two-photon excited fluorescence spectra of undoped- and 2% TTPA-doped TAPC:3TPYMB blend (1:1) measured at the same condition. (Three curves with the same color indicate that the same sample has been measured three times.) (c) Two-photon excited fluorescence spectra of undoped- and 2% DCM-doped TAPC:3TPYMB blend (1:1) measured at the same condition. For (b) and (c), three spectra were measured on different areas for each sample. All the spectra were measured without a convergent lens. (d) Schematics of the two-photon excited fluorescence process in fluorescence emitter-doped TADF DA exciplex.
    Zhen Chen, Qian Zhou, Huitian Du, Yuan Yu, Chuang Zhang, Shenghao Han, Zhiyong Pang. Immensely enhanced color-adjustable upconversion fluorescence in electron donor-acceptor exciplex chromophores doped with fluorescent emitters[J]. Photonics Research, 2021, 9(5): 865
    Download Citation