• Journal of Geographical Sciences
  • Vol. 30, Issue 5, 743 (2020)
Zhipeng TANG1、2, Ziao MEI1、2, Weidong LIU1、2, and Yan XIA3、*
Author Affiliations
  • 1Key Laboratory of Regional Sustainable Development Modeling, Institute of Geographic Sciences and Natural Resources Research, CAS, Beijing 100101, China
  • 2College of Resources and Environment, University of Chinese Academy of Sciences, Beijing 100049, China
  • 3Institutes of Science and Development, CAS, Beijing 100190, China
  • show less
    DOI: 10.1007/s11442-020-1753-4 Cite this Article
    Zhipeng TANG, Ziao MEI, Weidong LIU, Yan XIA. Identification of the key factors affecting Chinese carbon intensity and their historical trends using random forest algorithm[J]. Journal of Geographical Sciences, 2020, 30(5): 743 Copy Citation Text show less
    Average reductions in Gini coefficient and the corresponding cumulative percentage importance as a function of carbon intensity index number
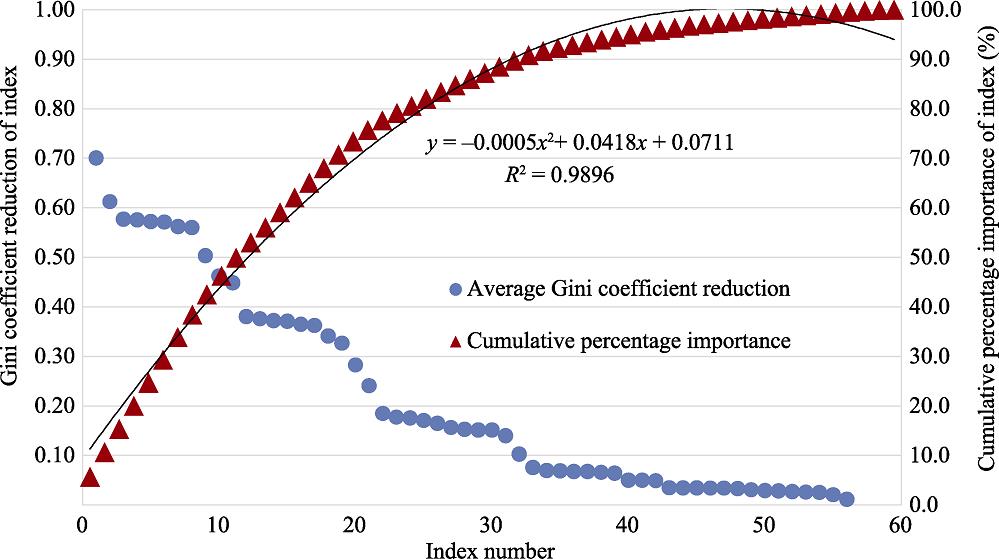
    Fig. 1. Average reductions in Gini coefficient and the corresponding cumulative percentage importance as a function of carbon intensity index number
    Percentages of factors affecting Chinese carbon intensity in different categories between 1980 and 2017
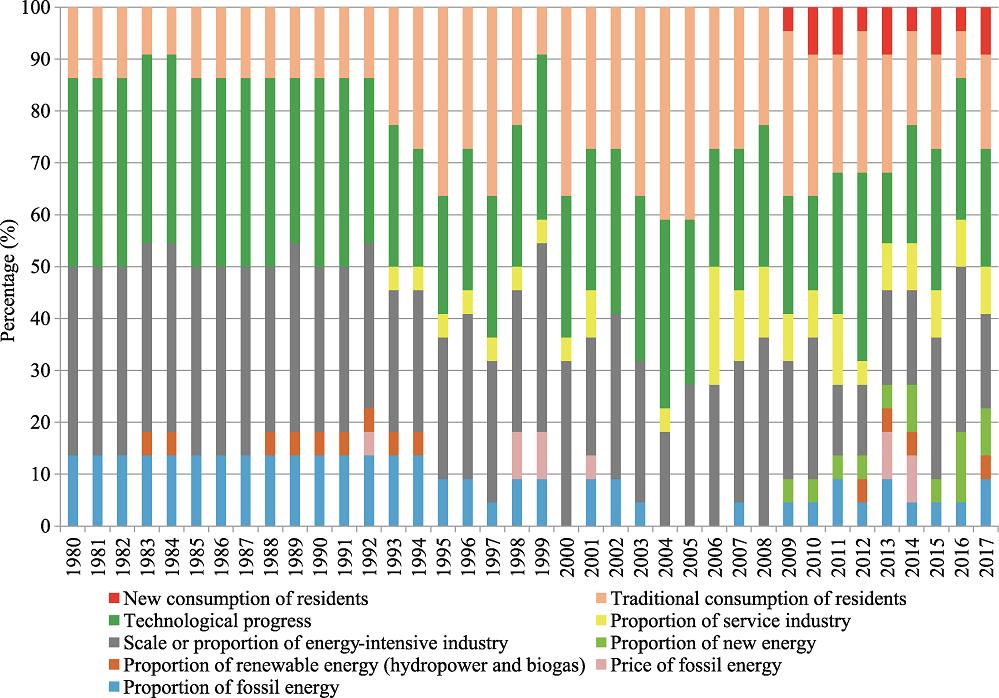
    Fig. 2. Percentages of factors affecting Chinese carbon intensity in different categories between 1980 and 2017
    Table 1.

    Categorization of factors influencing carbon intensity in China

    Carbon intensityindex number12345678
    Gini coefficient reduction0.7010.6130.5770.5760.5720.5710.5620.560
    Carbon intensityindex number910111213141516
    Gini coefficient reductions0.5040.4620.4490.3800.3760.3720.3710.365
    Carbon intensityindex number1718192021222324
    Gini coefficient reductions0.3620.3410.3270.2830.2410.1850.1770.176
    Carbon intensityindex number2526272829303132
    Gini coefficient reductions0.1700.1650.1560.1520.1510.1510.1400.103
    Carbon intensityindex number3334353637383940
    Gini coefficient reductions0.0750.0690.0690.0670.0670.0660.0640.050
    Carbon intensityindex number4142434445464748
    Gini coefficient reductions0.0500.0490.0350.0340.0340.0340.0340.033
    Carbon intensityindex number4950515253545556
    Gini coefficient reductions0.0310.0290.0280.0270.0260.0250.0200.011
    Table 2.

    Carbon intensity indicator numbers and corresponding average reductions in Gini coefficient

    Category/Year1980...2000...2010...20162017
    Proportion of fossil energy3...0...1...12
    Price of fossil energy0...0...0...00
    Proportion of renewable energy (hydropower and biogas)0...0...0...01
    Proportion of new energy0...0...1...32
    Scale or proportion ofenergy-intensive industry8...7...6...74
    Proportion of service industry0...1...2...22
    Technological progress8...6...4...65
    Traditional consumption of residents3...8...6...24
    New consumption of residents0...0...2...12
    Total22...22...22...2222
    Table 3.

    Numbers of key factors affecting Chinese carbon intensity per category by year between 1980 and 2017 1(1Note: Based on length limitations, Table 3 only lists the statistics for 1980, 2000, 2010, 2016, and 2017; please contact the author for additional data.)

    Zhipeng TANG, Ziao MEI, Weidong LIU, Yan XIA. Identification of the key factors affecting Chinese carbon intensity and their historical trends using random forest algorithm[J]. Journal of Geographical Sciences, 2020, 30(5): 743
    Download Citation