
Zhipeng TANG, Ziao MEI, Weidong LIU, Yan XIA. Identification of the key factors affecting Chinese carbon intensity and their historical trends using random forest algorithm[J]. Journal of Geographical Sciences, 2020, 30(5): 743
- Journal of Geographical Sciences
- Vol. 30, Issue 5, 743 (2020)
Abstract
1 Introduction
With the formal signing of the Paris Climate Agreement by the Chinese government in 2016, China has committed to reaching peak carbon emissions around 2030 and reducing carbon dioxide emissions per unit of gross domestic product (GDP), or carbon intensity, to 60%-65% of the 2005 level by 2030. The best way to achieve these goals remains a major issue faced by the Chinese government and an area of concern for Chinese society and the international community. A study on the effects of economic development on carbon intensity in China suggested that improving the energy structure is beneficial for reducing carbon intensity, whereas growing household consumption has the opposite effect (
The total carbon emissions of a country or region depend on its GDP and carbon intensity. Since China is still a developing country, long-term economic growth is necessary to ensure national prosperity and strength. Therefore, reaching peak carbon emissions by 2030 cannot be achieved by reducing economic growth; instead, it must be accomplished by decreasing carbon intensity. Previous studies on carbon intensity have mainly focused on the influential factors from the perspectives of energy and industrial structure, technological progress, consumption, and land use. The results of previous works suggest that optimizing the energy structure can directly reduce energy intensity, thereby reducing carbon intensity (
Currently, the main analytical methods applied to assess the factors affecting carbon intensity are path analysis (
2 Data sources and research methods
2.1 Data sources
This study focused on carbon intensity and its influencing factors from 1961 to 2017 based on data from the Maddison project database, IEA database, China Energy Statistics Yearbook, China Industrial Statistics Yearbook, and China Statistics Yearbook. Based on existing studies and avoiding overlap between factors as much as possible (
 |
Table 1.
Categorization of factors influencing carbon intensity in China
2.2 Random forest algorithm
Random forest is an integrated learning method proposed by Breiman in 2001 based on decision trees. The “randomness” of the random forest is reflected in the training of each tree. A range of the same number of elements of datasets are randomly selected from all training samples to train the algorithm. This data acquisition method is considered as bootstrap sampling. In each branch node variable of building the tree, several subsets of all features are randomly selected to obtain the best segmentation method of subset feature partition by purity calculation (e.g., information gain, information gain rate, and Gini coefficient). The “forest” is reflected in the full growth of each tree without pruning, and the number of trees affects the final decision value.
The size of the forest composed of trees is determined as the number of trees for which increasing the number of trees increases the computational load but does not significantly change the final decision value. Random forests are insensitive to multiple collinearities and robust to missing and unbalanced data; thus, they provide reasonable prediction results (
2.2.1 Bootstrap sampling
In the random forest algorithm, bootstrap sampling is used to extract multiple samples from the original sample. A decision tree is then constructed from each bootstrap sample, and the decision trees are combined to obtain the final result using the voting score rule (
In the bootstrap sampling process, the probability
When the value of
Equation (2) indicates that approximately 37% of the original sample set T does not appear in the bootstrap samples; these data are referred to as out-of-bag (OOB) data. The random forest algorithm generates multiple training sample sets using bootstrap sampling and then constructs multiple classifiers to form a “forest” classifier. Bootstrap sampling adopts random and independent sampling with playback, which can avoid information loss caused by random sampling to a large extent. Bootstrap sampling also overcomes the negative effects of sample class imbalance and improves the reliability of the algorithm.
2.2.2 Decision tree CART algorithm
A decision tree includes a root node, intermediate node, and leaf node, with each node representing the attributes of the object. The path from the root node through the intermediate node to the leaf node represents a decision rule. The generation of a decision tree is usually done recursively starting from the root node. A root node is divided into two subtrees. Then, starting from the subtree, it continues to produce the new root node and again the new root node produce the left and right subtrees. Each of root nodes continues to generate new subtrees recursively until leaf nodes are generated.
Many algorithms exist for generating decision trees, including CLS, ID3, C4.5, and CART node-splitting algorithms (
The CART algorithm, which was proposed in 1984 (
The CART algorithm is commonly used to construct decision trees in the random forest algorithm. The steps in the CART algorithm are detailed below (
1) Continuous characteristic variables are discretized. There are
2) Each partition’s Gini coefficient Gini(
For a given sample
According to value
3) For the dataset of current nodes, the nodes are split according to the principle of minimum Gini coefficient, and the decision tree is constructed recursively.
2.2.3 Random forest algorithm
The random forest algorithm is based on bootstrap sampling and the CART algorithm. The process of the random forest algorithm is divided into the following steps (
1) Generate training sets. Each tree corresponds to a training set. To construct
2) Construct each decision tree. Node splitting is mainly carried out from the root node through the intermediate node and to the leaf node based on the node splitting rule, which maximizes information gain and information gain rate while minimizing the Gini coefficient. Generally, the minimum Gini coefficient in the CART algorithm is used for node splitting. The node splitting process is repeated. This specific process allows to randomly select several attributes from all attributes according to a certain probability distribution to participate in the process of node splitting. As
3) Form the forest. The above two steps are repeated to build a large number of decision trees, and the random forest is generated. Each tree in the forest is used to classify the samples in the OOB data. One occurrence of the category is denoted as one vote accordingly, the votes for each category are counted, and the category with the largest number of votes is considered the sample category. The proportion of samples not correctly classified in the OOB data is the error rate for the OOB data.
As
This shows that the generalization error GE* is close to a probability upper limit. Overfitting does not occur as the number of decision trees increases, indicating good robustness.
3 Empirical analysis
3.1 Identification of key factors affecting carbon intensity in China
Obtaining reliable results using machine learning often requires a sufficient number of samples. Thus, in this study, the sample size every 20 years as a dataset from 1961 to 2017, the first dataset of the year 1980 includes the sample from 1961 to 1980, the second dataset of the year 1981 includes the sample from 1962 to 1981 and slide backwards year by year to obtain the annual dataset of 1980-2017. Each dataset has thousands of indicators to ensure a sufficient number of samples. Based on bootstrap sampling, a training set was created for each dataset. Then, based on the CART algorithm, the attribute partition of each training set was created by splitting different nodes. The node splitting continued until the Gini coefficient was minimized [Eq. (6)], ensuring that all partitions were of the highest purity; each partition with the highest purity was a decision tree. By repeating the previous sampling, training, and node partitioning, multiple decision trees were established, and the random forest was generated. The above process was primarily implemented by programming in R software.
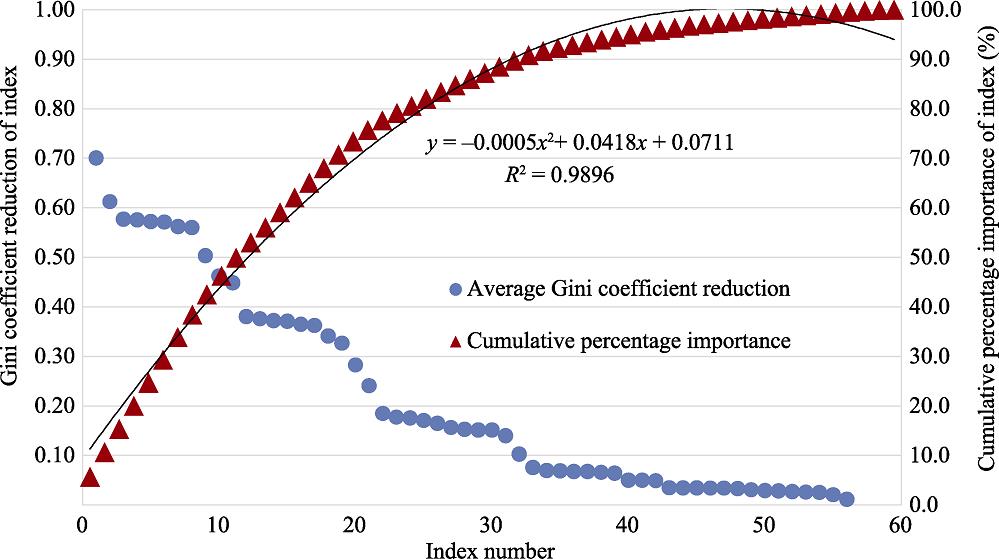
In the completed dataset of partitioning attributes of node splitting, the Gini coefficient reflects the purity of the attribute partition in the decision tree, with a smaller Gini coefficient indicating greater purity. When the reduction in Gini coefficient was large, the average purity of all decision trees in the forest increased substantially, indicating that the node variable had a large effect on the forest. Therefore, we calculated the reduction in Gini coefficient for different indicators in each dataset; based on the results, the importance of each factor affecting carbon intensity in China from 1980 to 2017 was evaluated. Because Gini coefficients in random forests are calculated based on information entropy according to the additivity of the entropy value, the sum of the reductions in Gini coefficient for all factors represents the importance of all factors in the index system. Therefore, to uniformly set the quantitative threshold for key factors affecting carbon intensity, we sorted the reductions in Gini coefficient from large to small for each factor from 1980 to 2017 and then calculated the average for each factor from 1980 to 2017 to obtain the corresponding relationships between carbon intensity index number and average reduction in Gini coefficient (
| Carbon intensity | 1 | 2 | 3 | 4 | 5 | 6 | 7 | 8 |
|---|---|---|---|---|---|---|---|---|
| Gini coefficient reduction | 0.701 | 0.613 | 0.577 | 0.576 | 0.572 | 0.571 | 0.562 | 0.560 |
| Carbon intensity | 9 | 10 | 11 | 12 | 13 | 14 | 15 | 16 |
| Gini coefficient reductions | 0.504 | 0.462 | 0.449 | 0.380 | 0.376 | 0.372 | 0.371 | 0.365 |
| Carbon intensity | 17 | 18 | 19 | 20 | 21 | 22 | 23 | 24 |
| Gini coefficient reductions | 0.362 | 0.341 | 0.327 | 0.283 | 0.241 | 0.185 | 0.177 | 0.176 |
| Carbon intensity | 25 | 26 | 27 | 28 | 29 | 30 | 31 | 32 |
| Gini coefficient reductions | 0.170 | 0.165 | 0.156 | 0.152 | 0.151 | 0.151 | 0.140 | 0.103 |
| Carbon intensity | 33 | 34 | 35 | 36 | 37 | 38 | 39 | 40 |
| Gini coefficient reductions | 0.075 | 0.069 | 0.069 | 0.067 | 0.067 | 0.066 | 0.064 | 0.050 |
| Carbon intensity | 41 | 42 | 43 | 44 | 45 | 46 | 47 | 48 |
| Gini coefficient reductions | 0.050 | 0.049 | 0.035 | 0.034 | 0.034 | 0.034 | 0.034 | 0.033 |
| Carbon intensity | 49 | 50 | 51 | 52 | 53 | 54 | 55 | 56 |
| Gini coefficient reductions | 0.031 | 0.029 | 0.028 | 0.027 | 0.026 | 0.025 | 0.020 | 0.011 |
Table 2.
Carbon intensity indicator numbers and corresponding average reductions in Gini coefficient
If the number of key factors is too large, the significance of identifying key factors will be lost. However, if the number of key factors is too small, it will be difficult to grasp the importance of the entire carbon intensity factor index system. We want proper index numbers to reflect the importance of the entire carbon intensity factor index system. Therefore, according to the 2/3 principle, that is, the set threshold of the number of indicators can cover more than 2/3 of the importance of the entire carbon intensity factor index system, which can be regarded as a key factor. As shown in
![]()
Figure 1.Average reductions in Gini coefficient and the corresponding cumulative percentage importance as a function of carbon intensity index number
In 1980, the five factors affecting Chinese carbon intensity with the largest reductions in Gini coefficient were the proportion of natural gas, standard coal consumption for power generation, synthetic ammonia, caustic soda, and comprehensive energy consumption per unit of ethylene industry. In 1981, the top five factors were proportion of natural gas, standard coal consumption for power supply, total labor productivity, comprehensive energy consumption per unit of cement industry, and comprehensive energy consumption per unit of ethylene industry. In 1991, the top five factors were proportion of oil, proportion of coal, motorcycles per 100 urban households, proportion of natural gas, and synthetic ammonia. In 2000, the top five factors were proportion of construction industry, private cars per 100 urban households, comprehensive energy consumption per unit of rough steel industry, power plant line loss rate, and comprehensive energy consumption per unit of ethylene industry. In 2010, the top five factors were proportion of coal, proportion of information transmission, computer services, and software industry, proportion of science and technology appropriation to total fiscal expenditure, proportion of geothermal, and TV sets per 100 rural households. In 2017, the top five factors were proportion of coal, proportion of hydroelectric, conversion efficiency of coking, washing machines per 100 urban households, and energy consumption per unit area of public buildings. The top 22 factors affecting carbon intensity in China were identified for each year from 1980 to 2017 and classified as indicated in
| Category/Year | 1980 | ... | 2000 | ... | 2010 | ... | 2016 | 2017 |
|---|---|---|---|---|---|---|---|---|
| Proportion of fossil energy | 3 | ... | 0 | ... | 1 | ... | 1 | 2 |
| Price of fossil energy | 0 | ... | 0 | ... | 0 | ... | 0 | 0 |
| Proportion of renewable energy (hydropower and biogas) | 0 | ... | 0 | ... | 0 | ... | 0 | 1 |
| Proportion of new energy | 0 | ... | 0 | ... | 1 | ... | 3 | 2 |
| Scale or proportion of | 8 | ... | 7 | ... | 6 | ... | 7 | 4 |
| Proportion of service industry | 0 | ... | 1 | ... | 2 | ... | 2 | 2 |
| Technological progress | 8 | ... | 6 | ... | 4 | ... | 6 | 5 |
| Traditional consumption of residents | 3 | ... | 8 | ... | 6 | ... | 2 | 4 |
| New consumption of residents | 0 | ... | 0 | ... | 2 | ... | 1 | 2 |
| Total | 22 | ... | 22 | ... | 22 | ... | 22 | 22 |
Table 3.
Numbers of key factors affecting Chinese carbon intensity per category by year between 1980 and 2017 1(1Note: Based on length limitations,
3.2 Historical evolution analysis of the key factors affecting carbon intensity in China
Based on the numbers of key factors in different categories from 1980 to 2017 (
![]()
Figure 2.Percentages of factors affecting Chinese carbon intensity in different categories between 1980 and 2017
According to
Overall, the historical evolution of key factors affecting carbon intensity can be roughly divided into three stages:
1) From the early 1980s to 1991, the key factors influencing carbon intensity were in the categories of scale or proportion of energy-intensive industry, proportion of fossil energy, technological progress, and traditional consumption of residents. During this period, the level of economic development in China was low, and extensive development was occurring. The economic structure was dominated by energy-intensive industries, and energy consumption was dominated by coal. Production factors such as standard coal consumption in power generation had a strong effect on carbon intensity during the early stage of Chinese economic development.
2) From 1992 to 2007, China underwent a period of opening up, and the rate of economic growth was high. This was accompanied by an increase in the incomes of Chinese residents along with accelerated consumption of household appliances and transportation resources. China’s entry into the World Trade Organization in 2001 further expanded its opening up to the outside world, and the proportion of service industry within the Chinese economy increased steadily with the development of electronic information technology. In 1993, China changed from an oil exporter to a net oil importer for the first time, and demand for energy increased. From 1992 to 2007, the effects of scale or proportion of energy-intensive industry, proportion of fossil energy, technological progress, and traditional consumption of residents on carbon intensity increased significantly, and the proportion of service industry and price of fossil energy began to have important effects. Overall, from 1992 to 2007, the key factors affecting carbon intensity changed from production factors to production and consumption factors; thus, both production and consumption factors should be considered in efforts to reduce carbon intensity.
3) After the global financial crisis in 2008, China began to adjust its economic structure and implement measures to save energy and reduce emissions. The Chinese government supported new energy types and invested in the research and development of various energy-saving and emission-reducing technologies. Meanwhile, the Internet became universally integrated into the lives of Chinese residents, high-speed rail travel greatly shortened commute times, and the prevalence of e-commerce rapidly increased. From 2008 to 2017, the effects of emerging industries and consumption on carbon intensity increased significantly, and the effects of the scale or proportion of energy-intensive industry, proportion of fossil energy, technological progress, traditional consumption of residents, proportion of service industry, price of fossil energy, proportion of new energy, new consumption of residents, and proportion of science and technology appropriation to total fiscal expenditure emerged. This indicates that in addition to the traditional consumption of residents, the effects of new consumption of residents on carbon intensity are also important and should be considered in the development of energy-saving and emission-reduction policies in the future.
4 Conclusions and implications
Global climate change is a complex issue at the intersection of nature and society. Developing a low-carbon economy is the only way to deal with global climate change. As a responsible country, China has promised to reduce carbon intensity to 60%-65% of the 2005 level by 2030. To achieve this goal, it is first necessary to identify the key factors affecting carbon intensity. These key influential factors can then be used to reduce carbon intensity by implementing effective policy measures.
In view of the shortcomings of traditional quantitative methods, this study used a machine learning algorithm to identify the key factors affecting carbon intensity in China and then analyzed their historical trends. The main conclusions are summarized as follows:
(1) The key factors affecting carbon intensity in China from 1980 to 2017 were identified using random forest algorithm. Evolutionary analysis showed that the key factors and their effects changed over time. Therefore, policies designed to save energy and reduce emissions in China should also be adjusted over time.
The key factors affecting carbon intensity from 1980 to 1991 were mainly the scale or proportion of energy-intensive industry, proportion of fossil energy, and technological progress. After Deng Xiaoping’s Speech on the Southern Tour, the Chinese economy entered a period of rapid growth from 1992 to 2007, the proportion of service industry and price of fossil energy began to affect carbon intensity, and the effects of traditional consumption of residents increased. After the Global Financial Crisis in 2008, China entered a period of economic restructuring, and policies to save energy and reduce emissions were enacted. The proportion of new energy and new consumption of residents also began to affect carbon intensity during this time.
Overall, reducing the proportion of fossil energy, reducing the scale and proportion of energy-intensive industry, and promoting technological progress are the main measures that should be taken to reduce emissions. At the same time, China should vigorously develop the service industry, optimize the industrial structure, reduce the use of fossil energy by increasing the price of fossil energies via taxation, and promote the development of new energy resources. Green consumption, which includes the consumption of traditional household appliances, household transportation, and Internet e-commerce, is also important for reducing carbon intensity.
(2) With the widespread attention to the issue of global climate change, economic growth must be balanced with environmentally sustainable development. Carbon intensity is closely related to many aspects of social production and the lives of residents. The key factors affecting carbon intensity are different at different stages of economic development, as demonstrated in the paper.
Traditional statistical analysis cannot be used to assess the many factors affecting carbon intensity because of the need to overcome multicollinearity. Meanwhile, factor decomposition analysis tends to weaken the meaning of the decomposed factors or even explain them unilaterally. In contrast, machine learning has innate advantages when dealing with large datasets. Among machine learning approaches, random forest algorithm has good robustness and generalizability. However, the change of the international geopolitics circumstances along with the emergence of new technologies and industries create uncertainties for future socioeconomic development, and the applicability of stochastic forest algorithm for identifying the key factors affecting carbon intensity in uncertain scenarios requires further analysis.
Nevertheless, considering the rapid socioeconomic development in China, the factors affecting Chinese carbon intensity in the future will likely be closely related to the historical trends. To achieve China’s carbon intensity target by 2030, strategic planning and the adoption of strong policy measures are necessary. Therefore, understanding the historical evolution of the key factors affecting carbon intensity in China is important for formulating policy for the future.
References
[1] Bagging predictors. Machine Learning, 24, 123-140(1996).
[2] Random forests. Machine Learning, 45, 5-32(2001).
[3] et alClassification and Regression Trees. UK: Chapman & Hall/CRC(1984).
[4] Study on optimization of random forests algorithm. Beijing: Capital University of Economics and Business(2014).
[5] A summary of machine learning and related algorithms. Statistics and Information Forum, 22, 105-112(2007).
[6] The impact of carbon intensity restriction on welfare of urban and rural residents: An analysis based on CGE model. China Population, Resources and Environment, 28, 94-105(2018).
[7] Decomposition analysis of CO2 emission intensity between oil-producing and non-oil-producing sub-Saharan African countries. Energy Policy, 34, 3599-3611(2006).
[8] et alResidential carbon emission evolutions in urban-rural divided China: An end-use and behavior analysis. Applied Energy, 101, 323-332(2013).
[9] et alChanges in carbon intensity in China: Empirical findings from 1980-2003. Ecological Economics, 62, 683-691(2007).
[10] Spatial and econometric analysis of effect of industrial structure adjustment on carbon intensity in China. Soft Science, 31, 11-15(2017).
[12] Effects of changes in residential end-uses and behavior on aggregate carbon intensity: Comparison of 10 OECD countries for the period 1970 through 1993. Energy Economics, 23, 153-178(2001).
[13] A research on the threshold effect of the impact of technical progress on carbon intensity. Science & Technology Progress and Policy, 31, 22-26(2014).
[17] Research on the effects of energy structure adjustment in China on carbon intensity. Journal of Dalian University of Technology (Social Sciences), 37, 11-16(2016).
[18] How ambitious are China and India’s emissions intensity targets?. Energy Policy, 38, 6776-6783(2010).
[19] et alThreshold effects of household consumption level on residential carbon emissions. Journal of Arid Land Resources and Environment, 31, 38-43(2017).
[21] Sensitivity analysis of primary energy consumption structural change and carbon intensity. Resources Science, 35, 1438-1446(2013).
[22] The impact of industrial structure adjustment on China’s carbon intensity goal: The outlook of 2020. Science and Technology Management Research, 36, 232-236(2016).
[23] The impact of heterogeneous technological innovation on carbon intensity: A global evidence based on patent statistics. Journal of Beijing Institute of Technology (Social Sciences Edition), 19, 20-27(2017).
[24] Analysis of carbon emission efficiency and optimization of low carbon for agricultural land intensive use. Transactions of the Chinese Society of Agricultural Engineering, 30, 224-234(2014).
[25] China’s 2020 carbon intensity target: Consistency, implementations, and policy implications. Renewable and Sustainable Energy Reviews, 16, 4970-4981(2012).
[26] et alCarbon emission efficiency and optimization of low carbon for construction land development intensity in China according to provincial panel data. Resources Science, 38, 265-275(2016).
[27] Structural decomposition analysis of sources of decarbonizing economic development in China: 1992-2006. Ecological Economics, 68, 2399-2405(2009).
[28] Economic development pattern change impact on China’s carbon intensity. Economic Research Journal, 120-133(2010).
[29] et alA scientific study of establishing statistical index system. Statistical Theory and Practice, 8-12(2015).


Set citation alerts for the article
Please enter your email address

© Copyright 2018-2021 | Chinese Laser Press. All Rights Reserved 沪ICP备15018463号-20