
Zhuqiang Li, Ruifei Zhu, Fang Gao, Xiangyu Meng, Yuan An, Xing Zhong. Hyperspectral Remote Sensing Image Classification Based on Three-Dimensional Convolution Neural Network Combined with Conditional Random Field Optimization[J]. Acta Optica Sinica, 2018, 38(8): 0828001
- Acta Optica Sinica
- Vol. 38, Issue 8, 0828001 (2018)
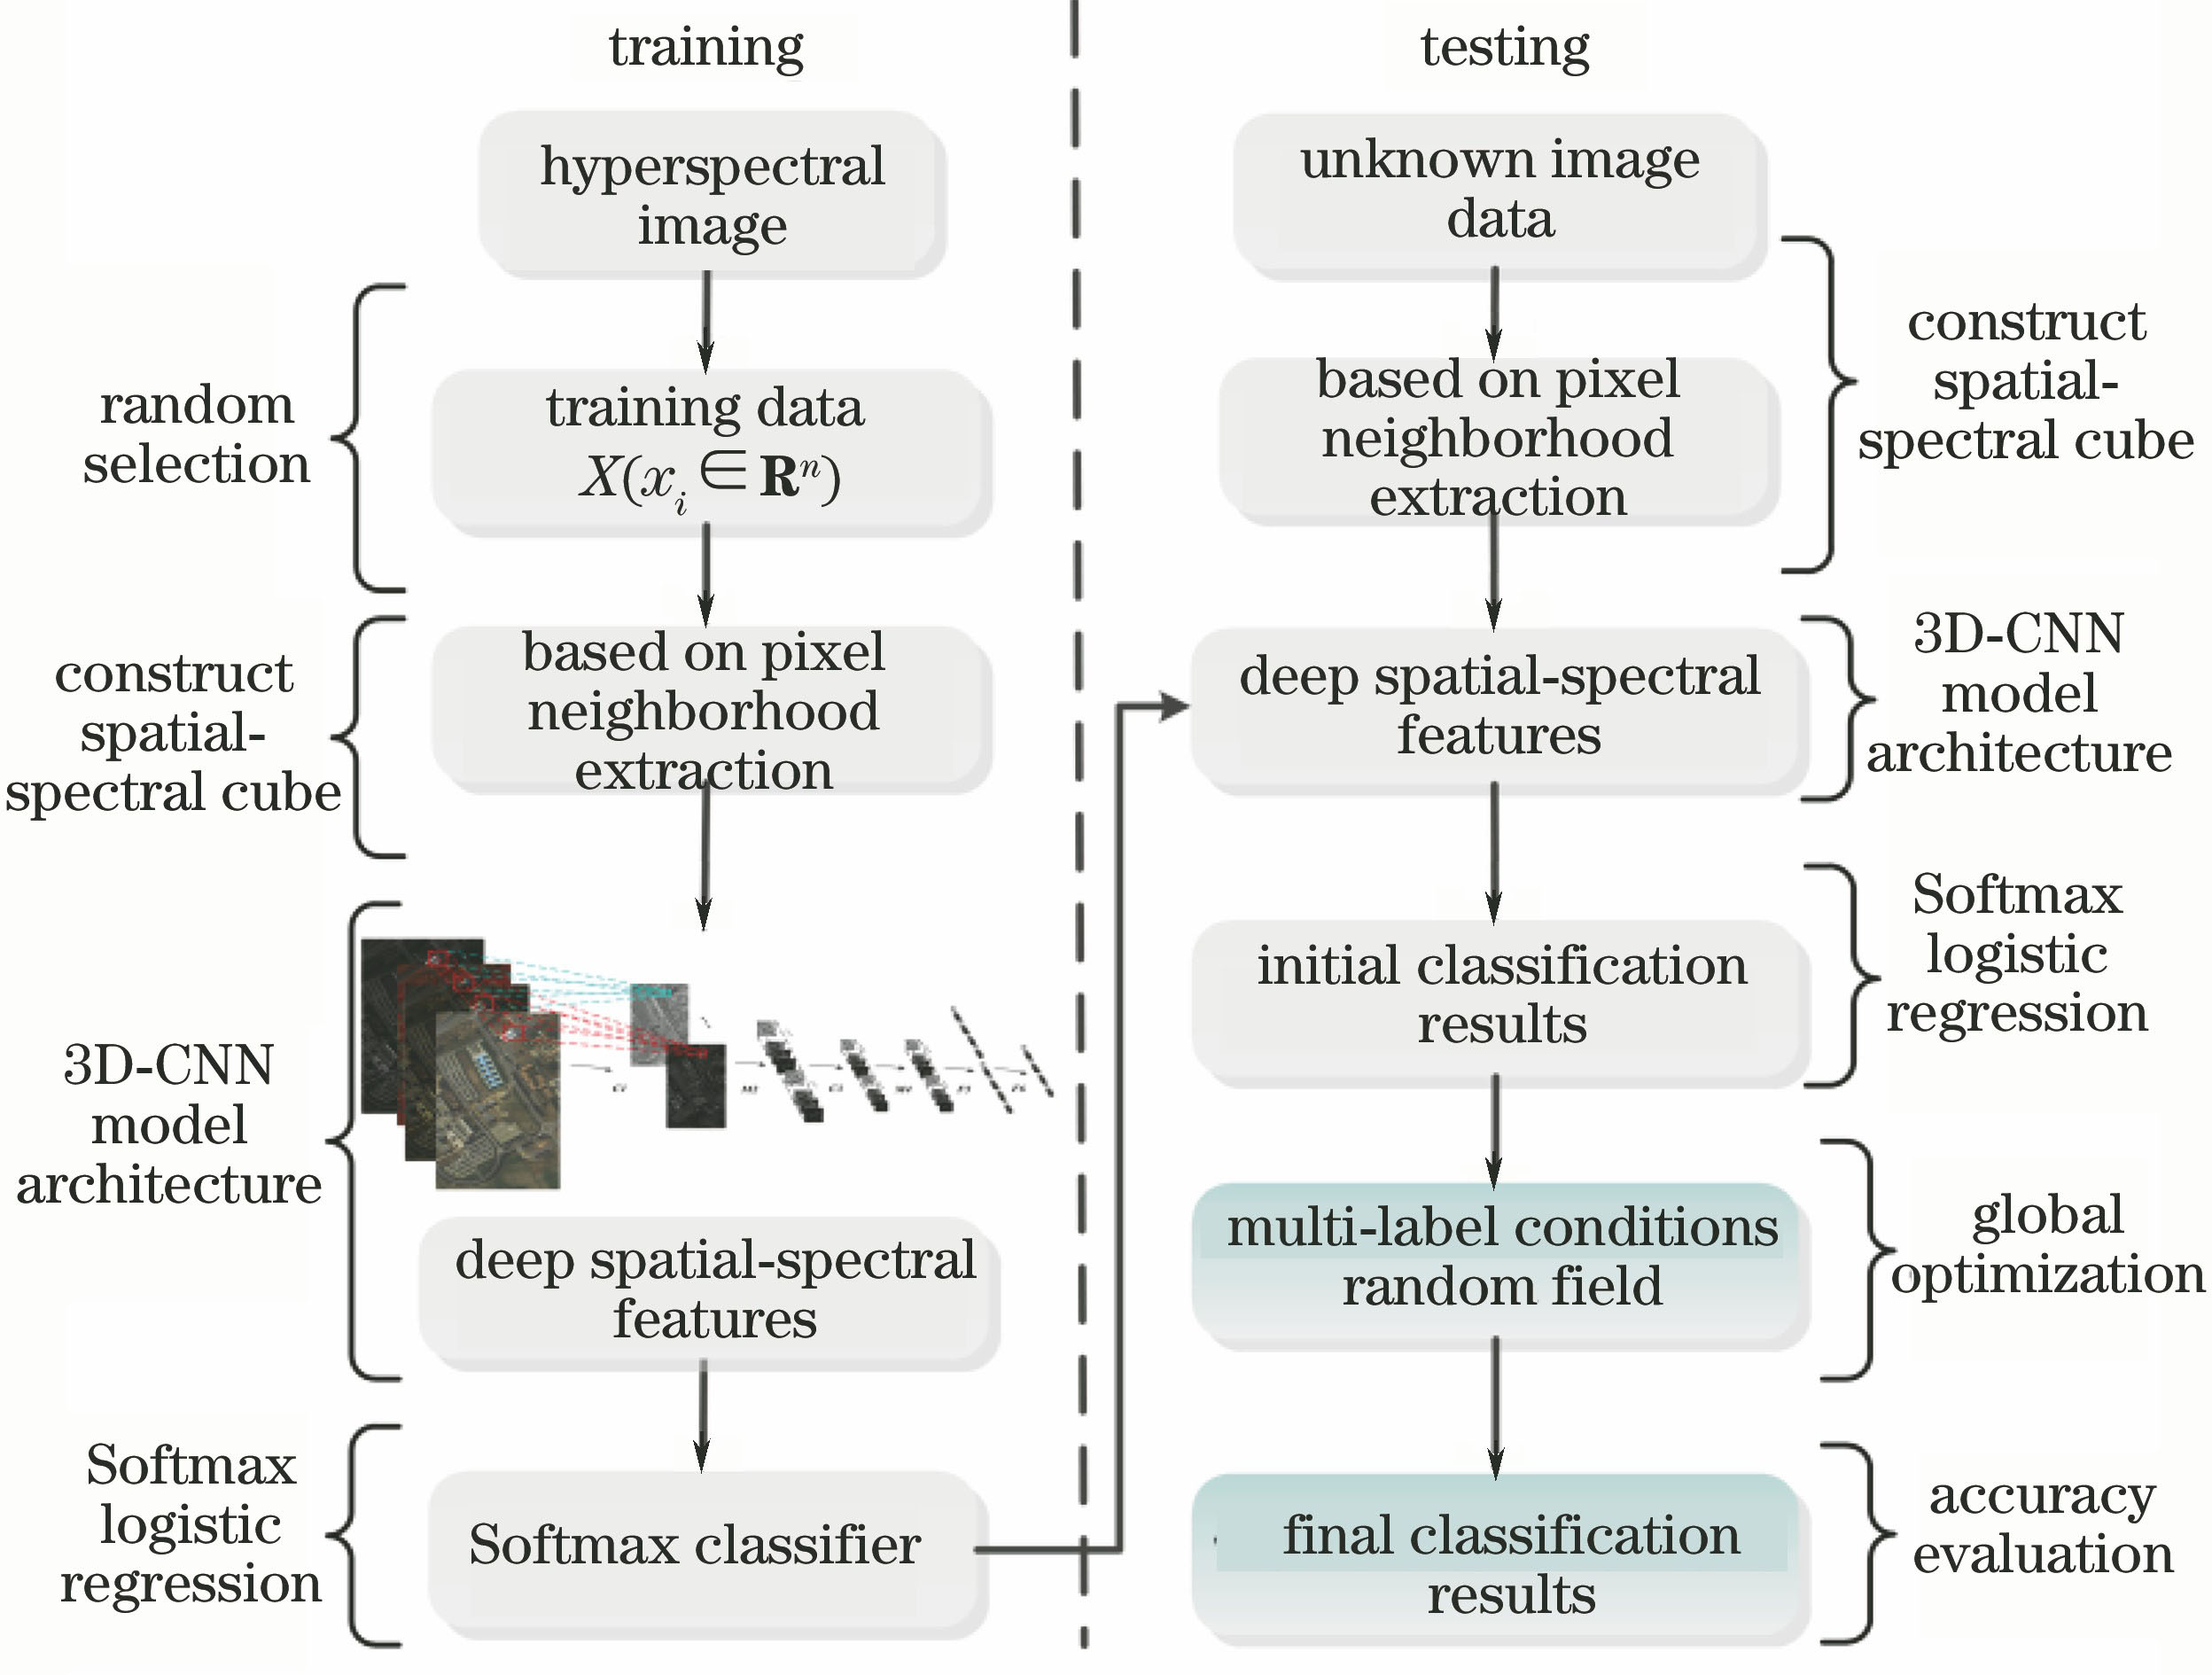
Fig. 1. Flow chart of experimental method
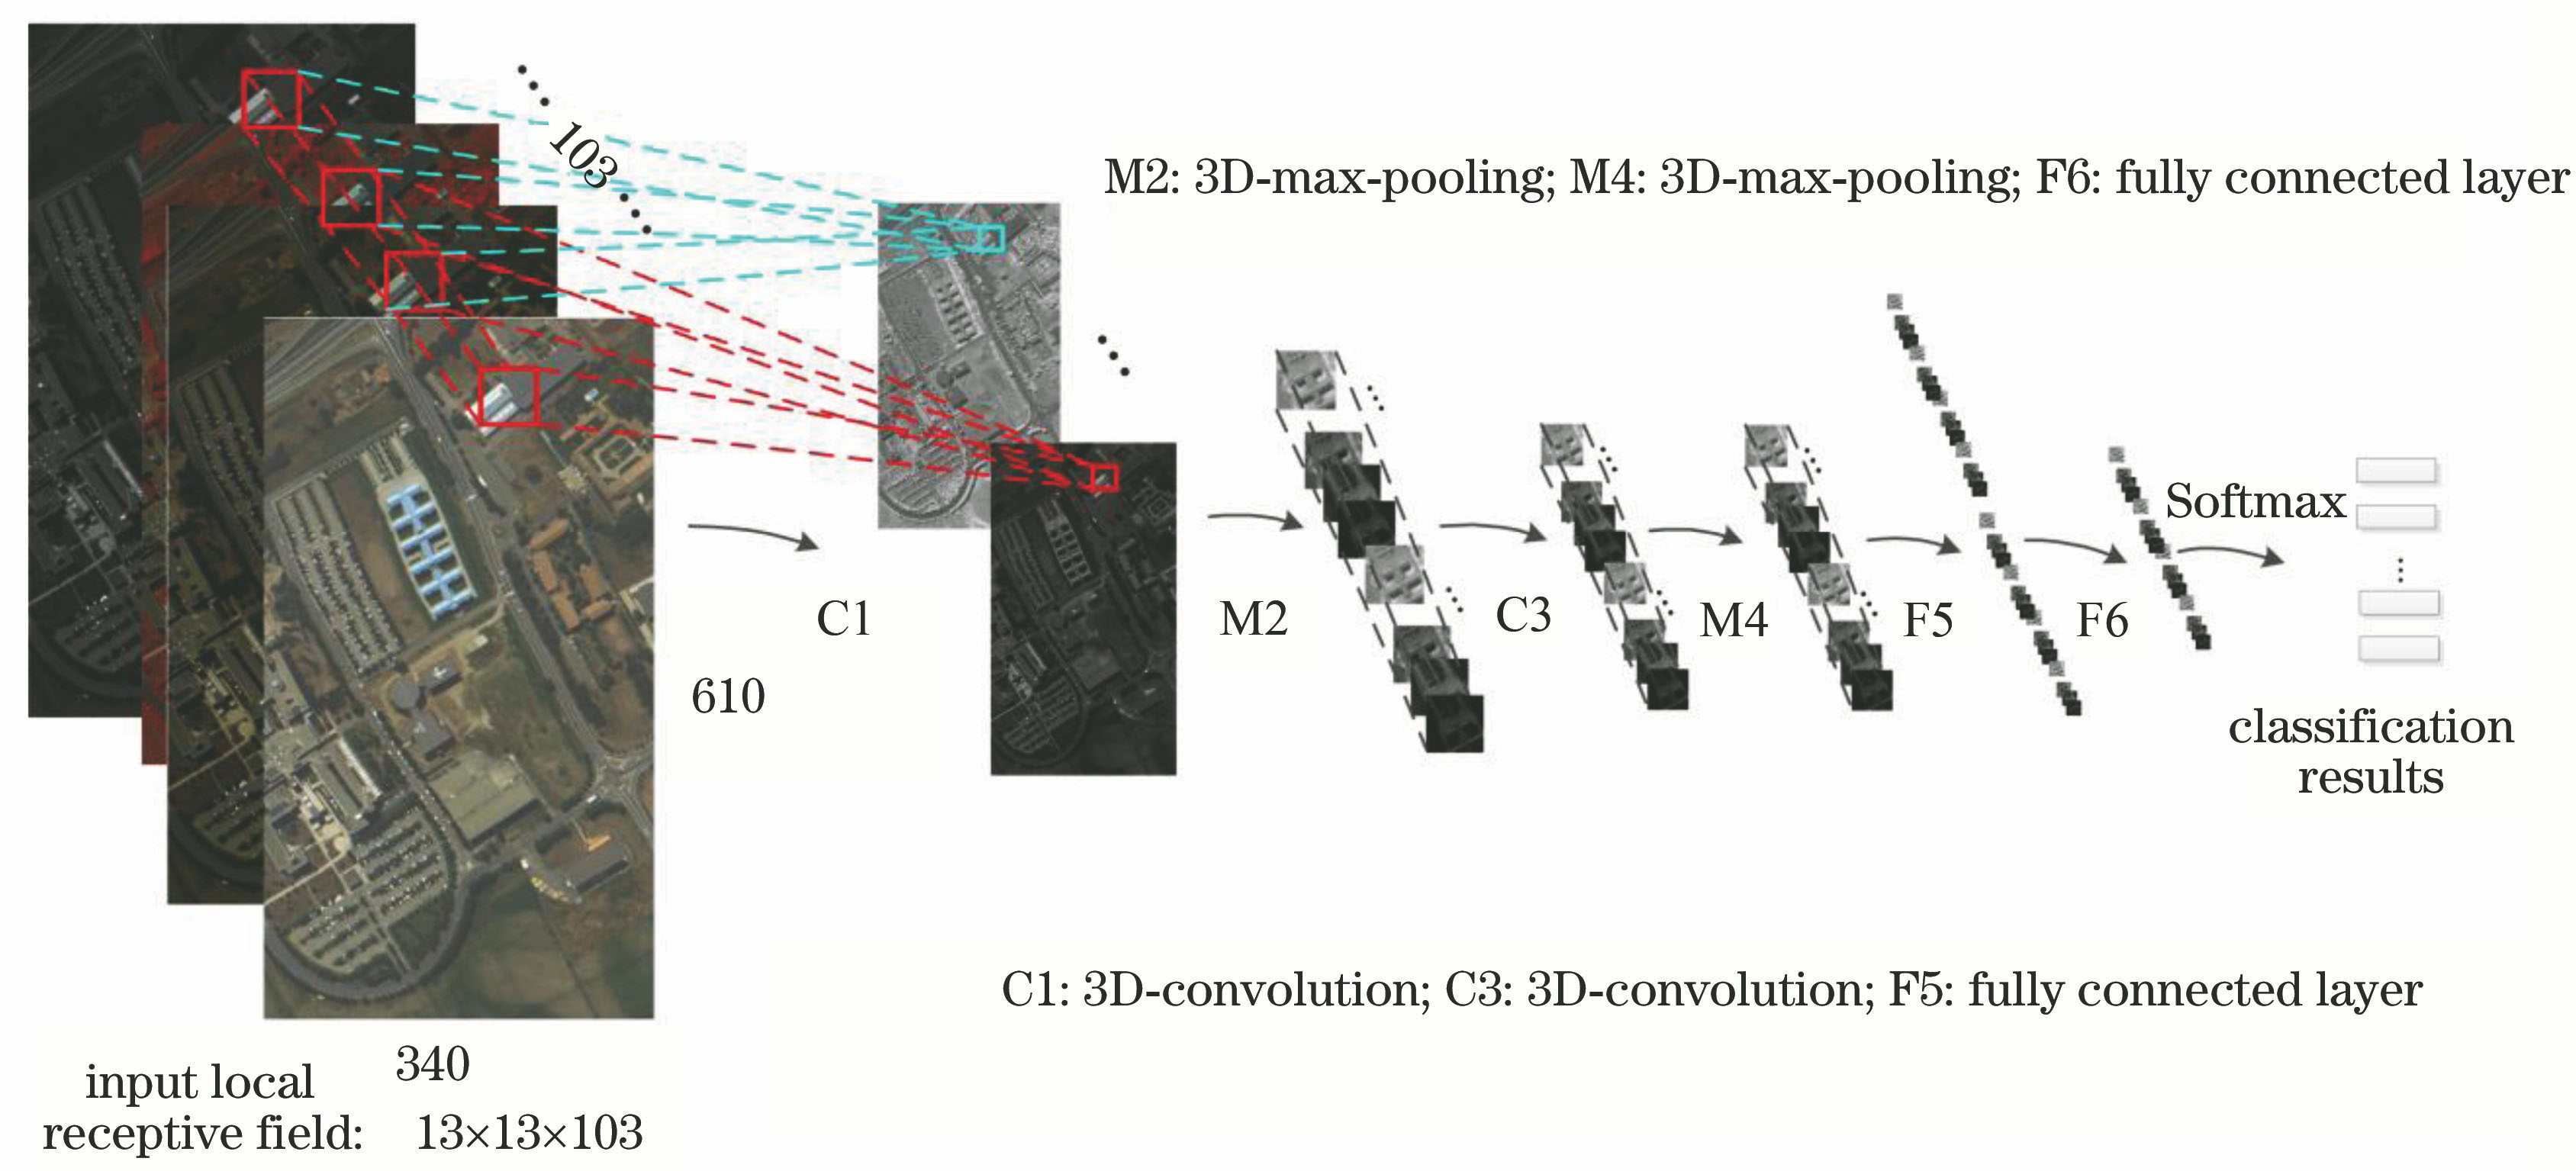
Fig. 2. Hyperspectral image classification framework based on spatial-spectral 3D-CNN model
Fig. 3. Illustration of hyperspectral pixel adjacent sparse matrix. (a) Pixel adjacent sparse matrix; (b) image four-neighbor model (K=4); (c) image eight-neighbor model (K=8)
Fig. 4. Classification results comparison of different algorithms on Indian Pines dataset (16 categories). (a) Pseud color image; (b) true image; (c) LDM-FL; (d) 2D-CNN; (e) 3D-CNN; (f) 3D-CNN-CRF
Fig. 5. Classification results comparison of different algorithms on Pavia University dataset (9 categories). (a) Pseud color image; (b) true image; (c) LDM-FL; (d) 2D-CNN; (e) 3D-CNN; (f) 3D-CNN-CRF
Fig. 6. Classification and unknown region generalization result on Pavia Center dataset (9 categories). (a) Pseud color image; (b) true image;(c) 3D-CNN-CRF(feature dimension: 34); (d) 3D-CNN-CRF (feature dimension: 68); (e) 3D-CNN-CRF (feature dimension: 102); (f) unknown region result
Fig. 7. Influence of spectral features with different dimensions on classification accuracy
| |||||||||||||||||||||||||||||||||||||||||||||||||||||||||||
Table 1. Related parameter settings of different algorithms
| ||||||||||||||||||||||||||||||||||||||||||||||||||||||||||||||||||||||||||||||||||||||||||||||||||||||||||||||||||||||||||||||||||||||||||
Table 2. Results of accuracy comparison of different algorithms on Indian Pines dataset (16 categories) %
| |||||||||||||||||||||||||||||||||||||||||||||||||||||||||||||||||||||||||||||||||||||||||
Table 3. Results of accuracy comparison of different algorithms on Pavia University dataset (9 categories)%
| ||||||||||||||||||||||||||||||||||||||||||||||||||
Table 4. 2D/3D-CNN training, testing and optimization time for three datasets

Set citation alerts for the article
Please enter your email address
© Copyright 2018-2021 | Chinese Laser Press. All Rights Reserved 沪ICP备15018463号-20