
Lei Zhenglong, Li Bingwei, Zhu Pingguo, Lu Wei, Xing Xixue. Effect of Wavelength on Droplet Transition Behaviors in Laser-CMT Hybrid Welding Process[J]. Chinese Journal of Lasers, 2018, 45(10): 1002006
- Chinese Journal of Lasers
- Vol. 45, Issue 10, 1002006 (2018)
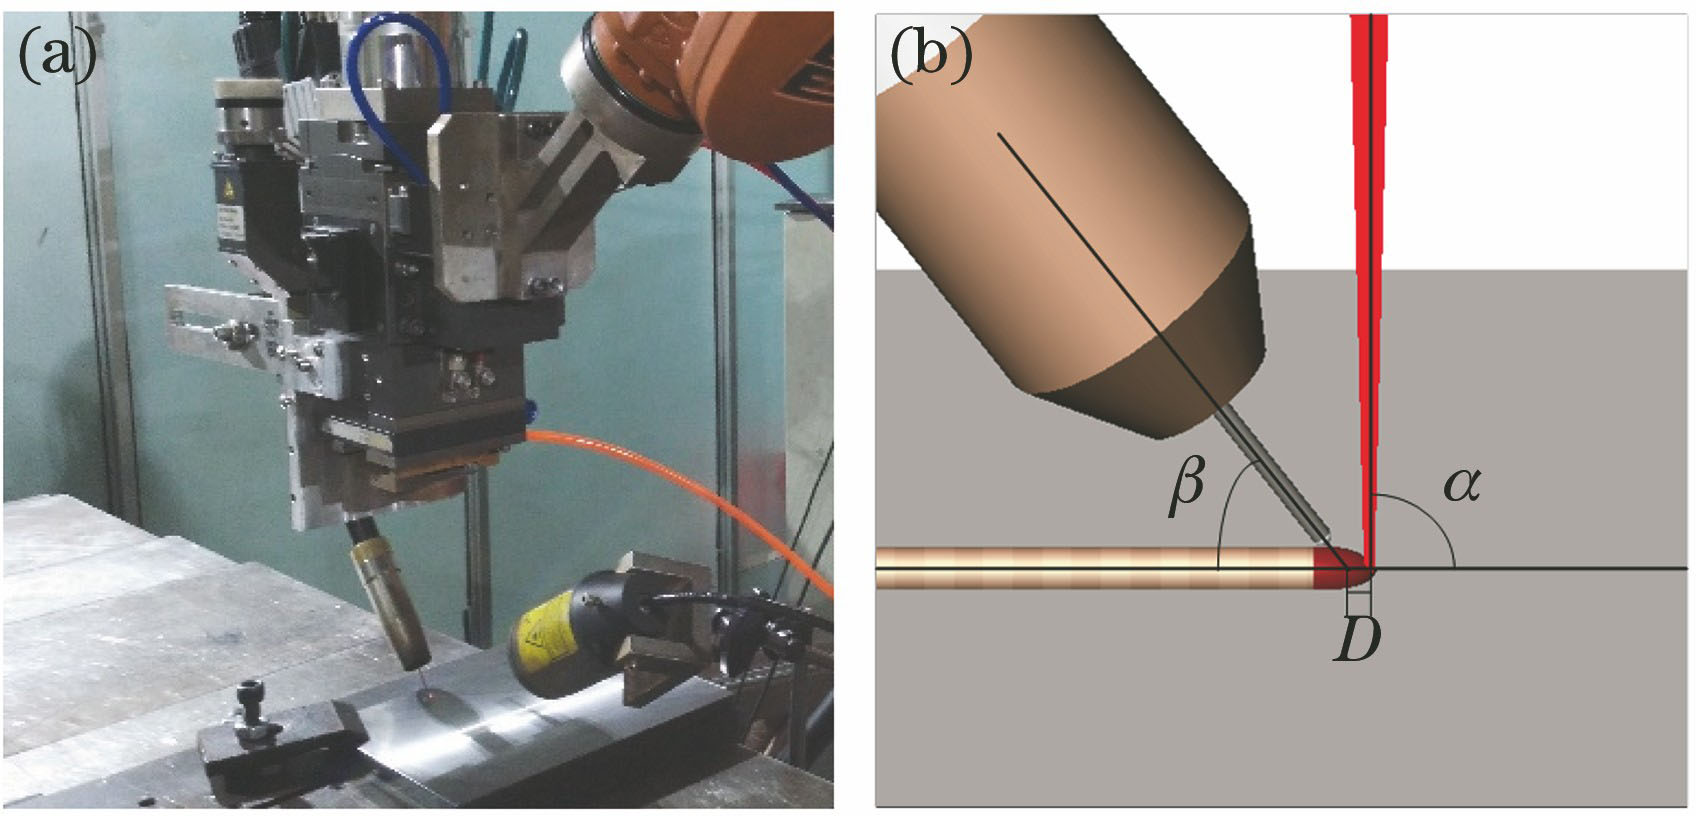
Fig. 1. Laser-CMT hybrid welding. (a) Equipment; (b) schematic

Fig. 2. Schematic of projection area measurement of droplet
Fig. 3. Weld surface morphologies under different welding methods. (a) I=40 A, P=1500 W; (b) I=80 A, P=1500 W
Fig. 4. Weld cross sections under different welding methods. (a) Laser; (b) CMT; (c) laser-CMT
Fig. 5. Droplet transition processes under different welding methods. (a) CMT; (b) laser-CMT
Fig. 6. Brightness curves of droplet transition processes under different welding methods
Fig. 7. Transfer period distribution of droplets under different welding methods
Fig. 8. Effect of laser power on droplet transition in laser-CMT welding process
Fig. 9. Molten pool shapes under different laser powers. (a) 1500 W; (b) 2500 W
Fig. 10. Effects of laser power on droplet transition under different laser wavelengths
Fig. 11. Fiber-laser-CMT hybrid welding process
Fig. 12. Change rate of transition frequency of droplet versus current under different laser wavelengths
Fig. 13. Spectral measurement data of CO2 laser plasma
Fig. 14. Boltzmann graph of plasma
Fig. 15. Temperature change of laser plasma under different wavelengths
Fig. 16. High speed camera shooting of keyhole eruption by lasers with different laser wavelengths. (a) CO2 laser; (b) fiber laser
|
Table 1. Chemical compositions of base metal and welding wire (mass fraction, %)
|
Table 2. Selected spectral information

Set citation alerts for the article
Please enter your email address
© Copyright 2018-2021 | Chinese Laser Press. All Rights Reserved 沪ICP备15018463号-20