Author Affiliations
School of Computer and Information, Hefei University of Technology, Hefei, Anhui 230009, Chinashow less
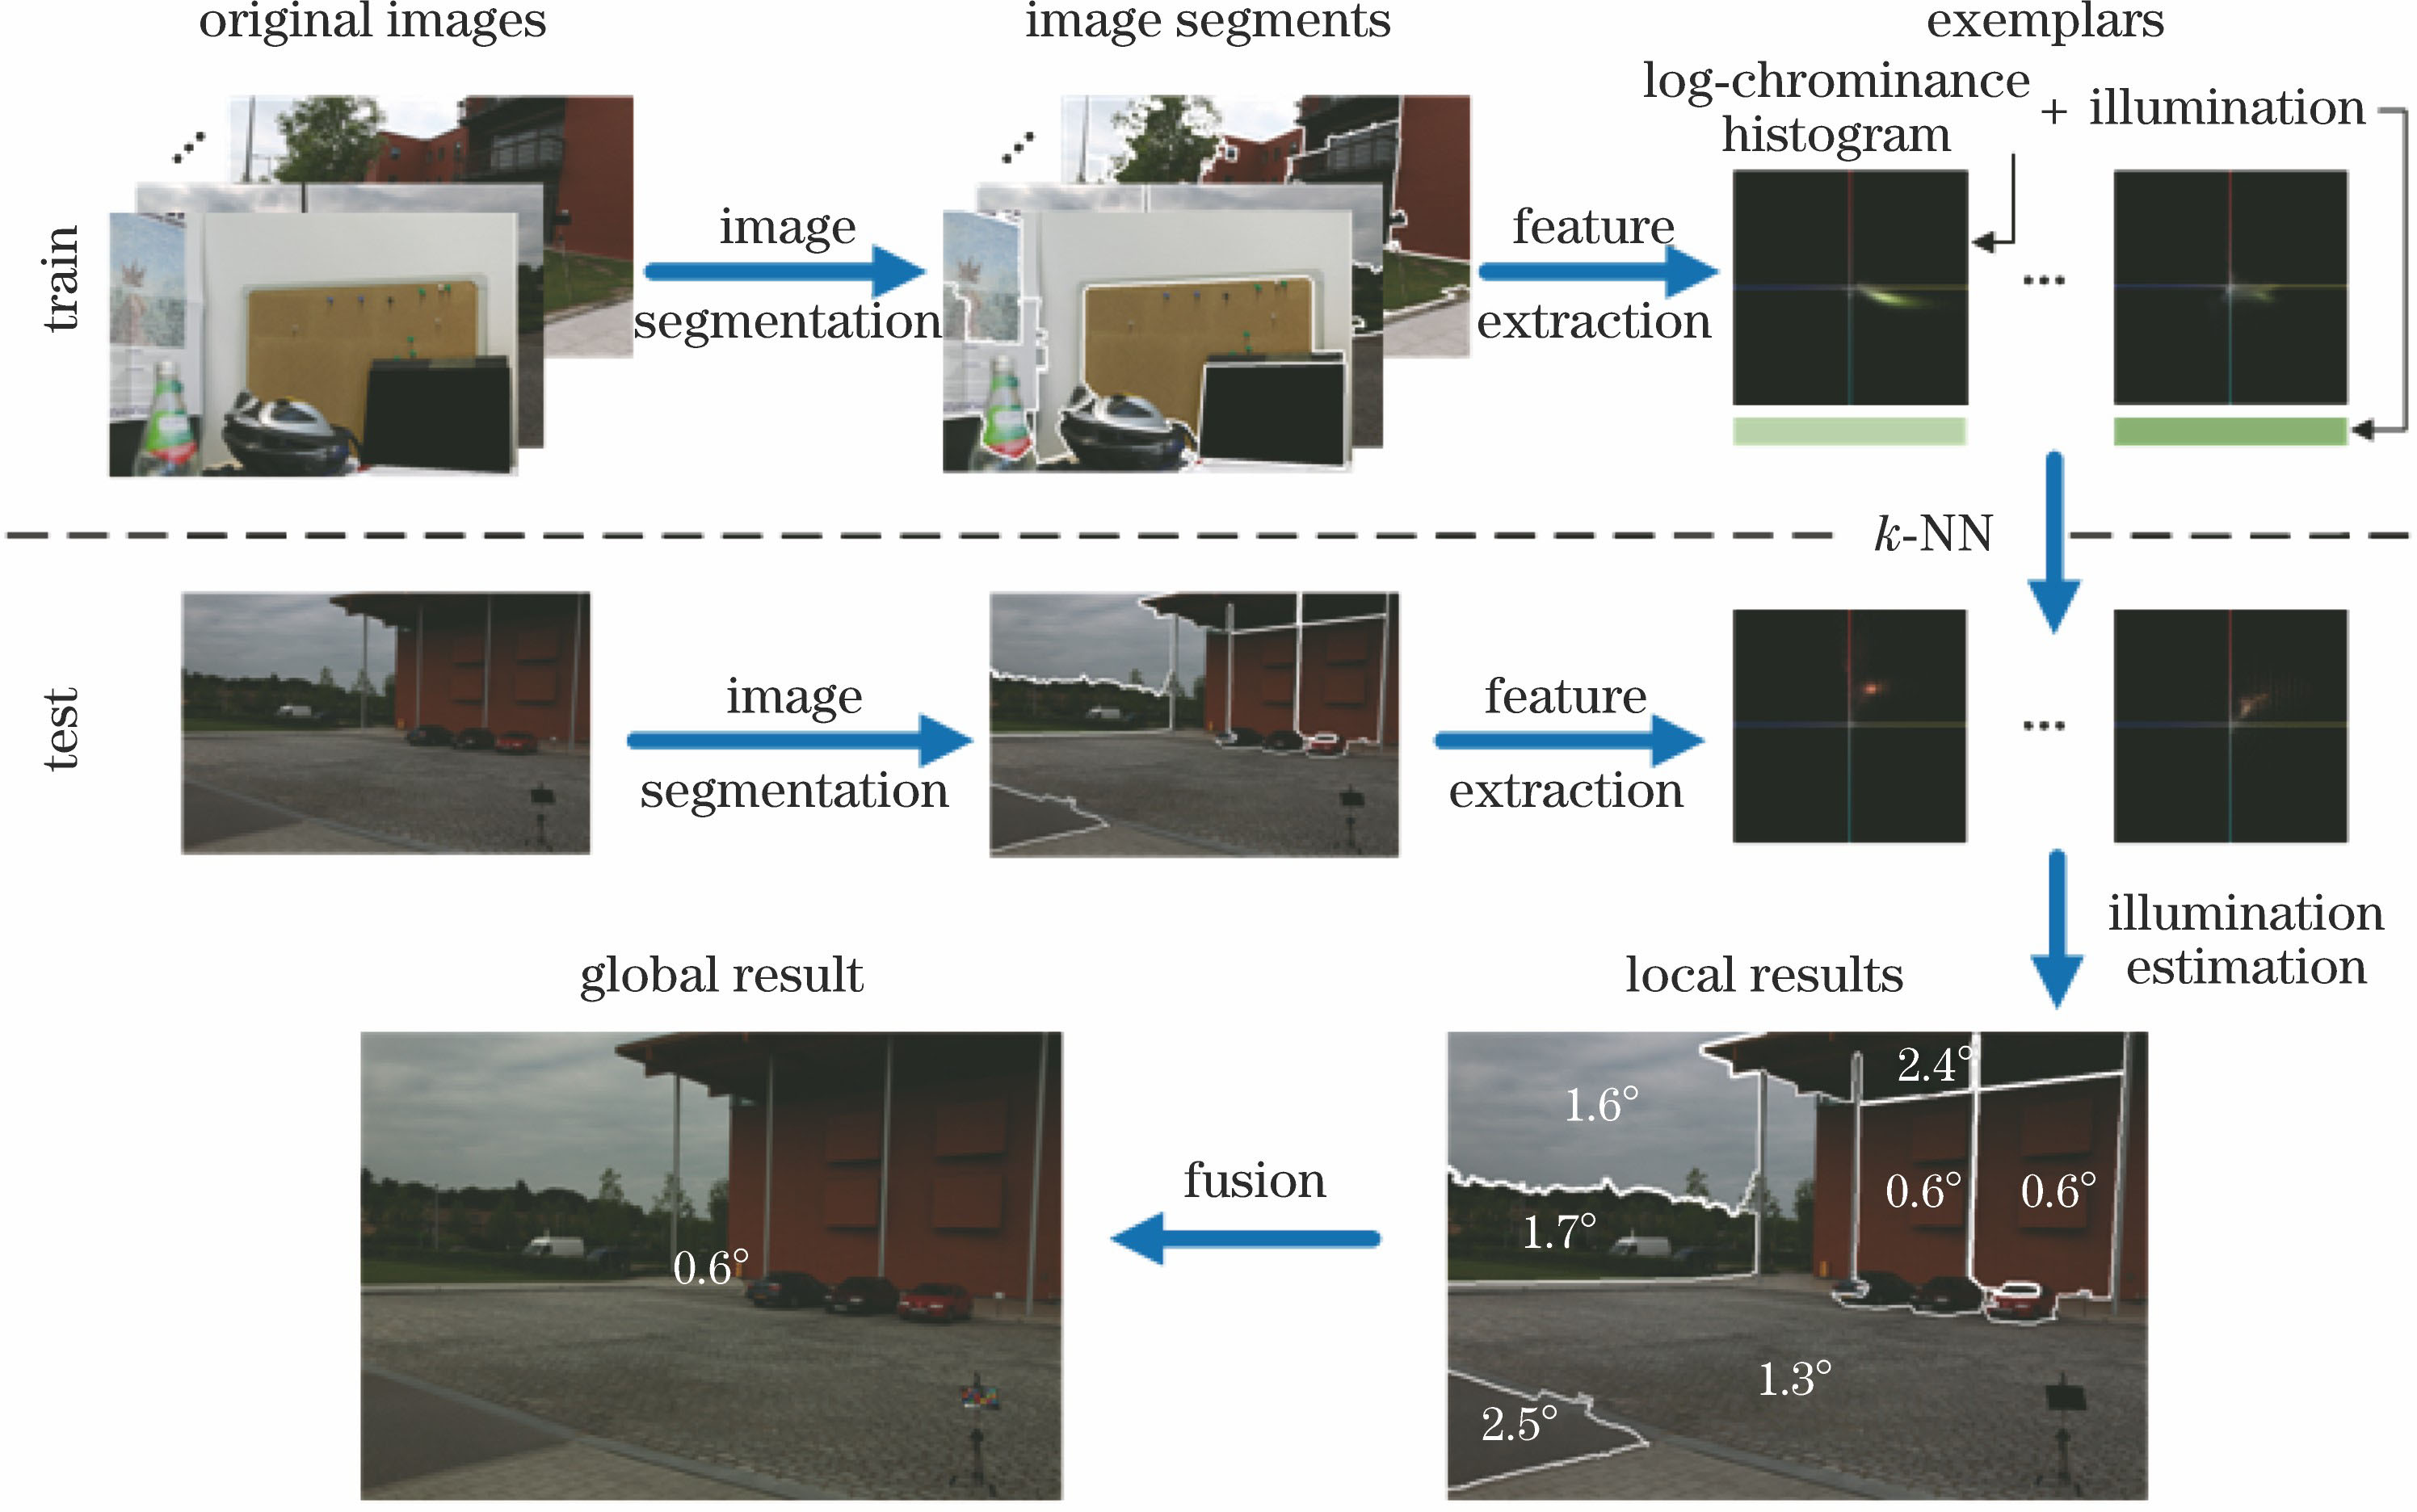
Fig. 1. Flow chart of algorithm
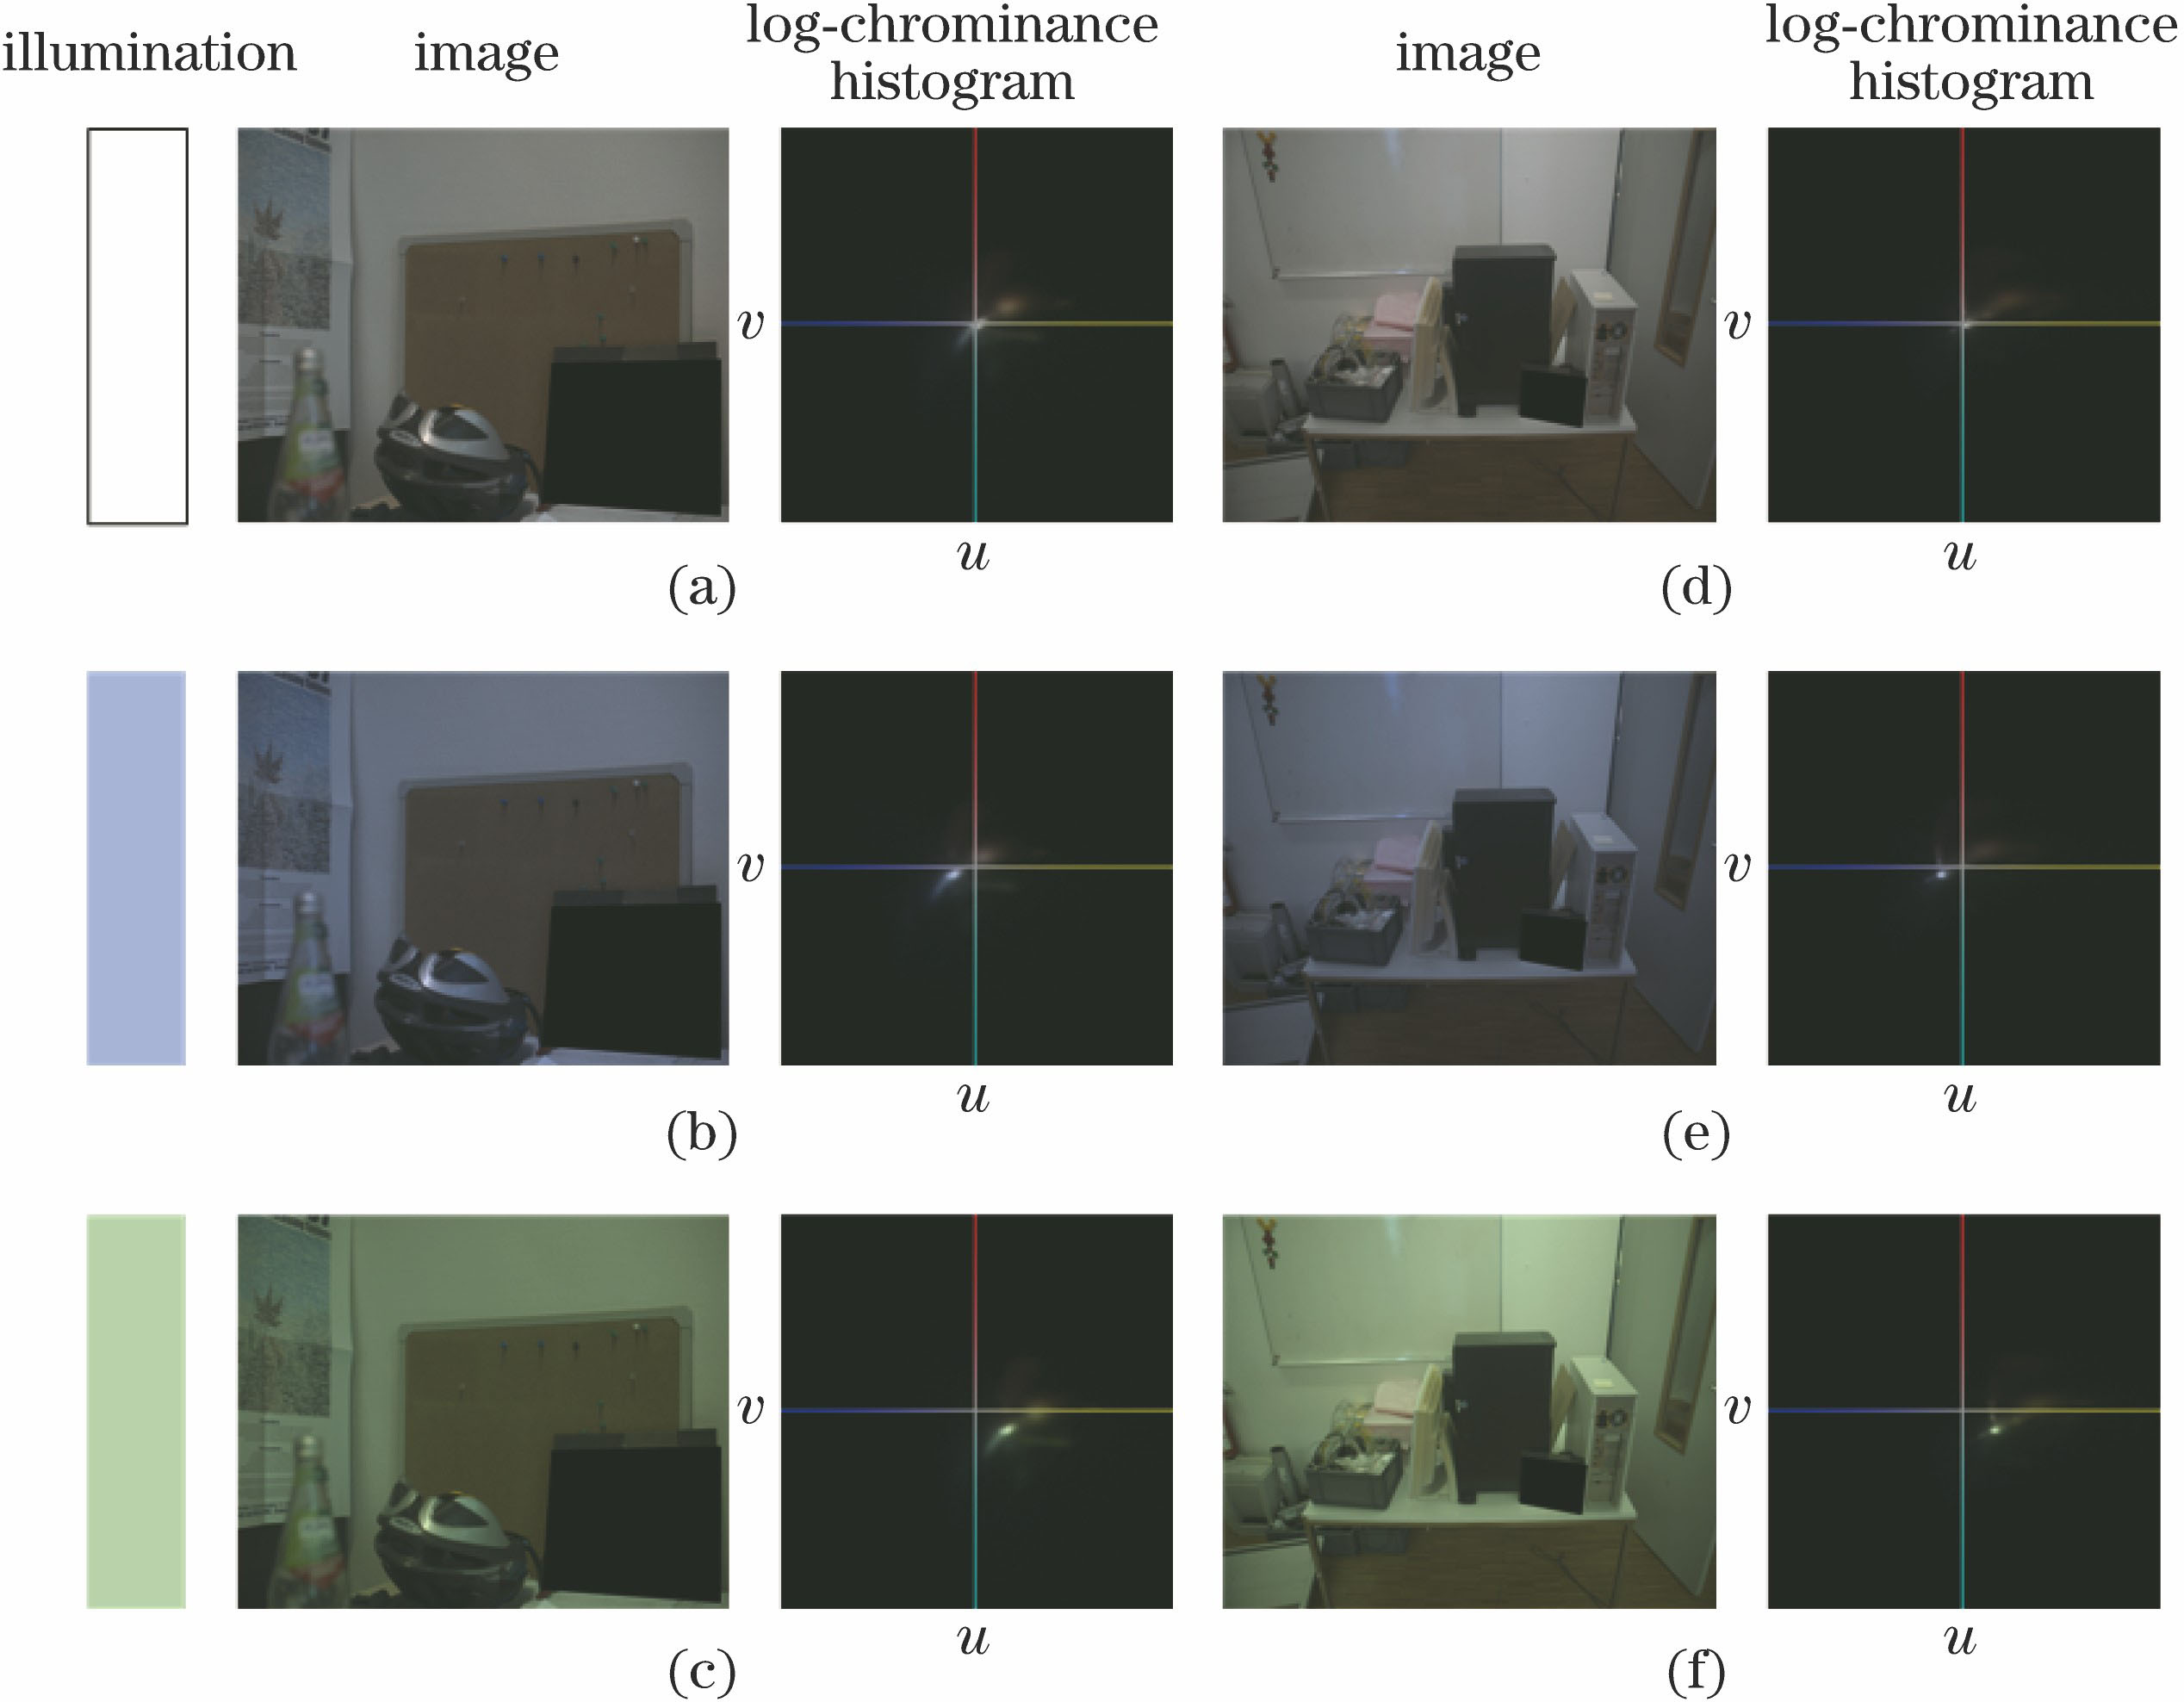
Fig. 2. Images and log-chrominance histograms of two scenes with three different illuminations. Scene 1 images and log-chrominance histograms under (a) white light, (b) blue light, (c) green light; scene 2 images and log-chrominance histograms under (d) white light, (e) blue light, (f) green light
Fig. 3. Illumination estimation process of single illuminant image
Fig. 4. Illumination estimation of multi-illuminant images. (a) Original images; (b) ground-truth values; (c) single illuminant estimation results; (d) double illuminant estimation results; (e) multi-illuminant estimation results
Fig. 5. Color correction results using different illumination estimation algorithms on SFU Grey-ball dataset. (a) Original images (b) Grey-World; (c) White-Patch; (d) Shades-of-Grey; (e) Grey-Edge; (f) Gamut Mapping; (g) Exemplar-Based; (h) proposed method
χ2 distance | Fig. 2(a) | Fig. 2(b) | Fig. 2(c) | Fig. 2(d) | Fig. 2(e) | Fig. 2(f) |
---|
Fig. 2(a) | - | -12.5997 | -18.9088 | -3.6787 | -10.2847 | -17.0799 | Fig. 2(b) | -12.5997 | - | -21.6092 | -12.3675 | -3.6276 | -19.5451 | Fig. 2(c) | -18.9088 | -21.6092 | - | -18.0153 | -19.1128 | -3.6758 | Fig. 2(d) | -3.6787 | -12.3675 | -18.0153 | - | -9.4169 | -15.6009 | Fig. 2(e) | -10.2847 | -3.6276 | -19.1128 | -9.4169 | - | -16.7831 | Fig. 2(f) | -17.0799 | -19.5451 | -3.6758 | -15.6009 | -16.7831 | - |
|
Table 1. χ2 distance of log-chrominance histograms in Fig. 2
Method | Mean | Median | Trimean | Max |
---|
Do nothing | 6.9 | 9.5 | 7.5 | 38.2 | Grey-World | 9.8 | 7.4 | 8.2 | 46.0 | White-Patch | 8.1 | 6.0 | 6.4 | | Shades-of-Grey | 7.0 | 5.3 | 5.6 | 36.6 | Grey-Edge | 7.0 | 5.2 | 5.5 | | Zeta-Image | 6.9 | 5.0 | - | - | Gamut Mapping | 6.9 | 4.9 | 5.2 | 37.1 | Bayesian | 6.7 | 4.7 | | 39.4 | Weighted Grey-Edge | 6.6 | 4.7 | 5.1 | 44.3 | Exemplar-Based | | | - | - | Proposed algorithm | 5.1 | 3.4 | 3.8 | 28.5 |
|
Table 2. Angular errors for original ColorChecker dataset for different illumination estimation algorithms(°)
Method | Mean | Median | Trimean | Max |
---|
Do nothing | 13.7 | 13.6 | 13.5 | 27.4 | Grey-World | 6.4 | 6.3 | 6.3 | 24.8 | White-Patch | 7.6 | 5.7 | 6.4 | 40.6 | Shades-of-Grey | 4.9 | 4.0 | 4.2 | 22.4 | Grey-Edge | 5.1 | 4.4 | 4.6 | 23.9 | Zeta-Image | 4.1 | 2.8 | - | - | Gamut Mapping | 4.2 | 2.3 | 2.9 | 23.2 | Bayesian | 4.8 | 3.5 | 3.9 | 24.5 | Multi-Cue | 3.3 | 2.2 | 2.6 | - | Deep-CC | | | | 14.8 | Exemplar-Based | 2.9 | 2.3 | 2.4 | 19.4 | Proposed algorithm | 2.5 | 1.8 | 2.0 | |
|
Table 3. Angular errors for re-processing of ColorChecker dataset for different illumination estimation algorithms(°)
Method | Mean | Median | Trimean | Max |
---|
Do nothing | 8.3 | 6.7 | 7.3 | 36.8 | Grey-World | 7.9 | 7.0 | 7.1 | 48.1 | White-Patch | 6.8 | 5.3 | 5.8 | | Shades-of-Grey | 6.1 | 5.3 | 5.5 | 41.2 | Grey-Edge | 5.9 | 4.7 | 5.1 | 41.2 | Gamut Mapping | 7.1 | 5.8 | 6.1 | 41.9 | Multi-Cue | 8.8 | 5.6 | 6.8 | - | Exemplar-Based | | | | 45.6 | Proposed algorithm | 4.2 | 3.0 | 3.4 | 43.0 |
|
Table 4. Angular errors for SFU Grey-ball dataset for different illumination estimation algorithms(°)
Method | Number of Illuminants |
---|
One | Two | Multi |
---|
Grey-World | 8.9 | 6.4 | - | White-Patch | 7.8 | 6.7 | - | Grey-Edge (n=1) | 6.4 | 5.6 | - | Grey-Edge (n=2) | | 5.1 | - | Exemplar-Based | 5.1 | | | Proposed algorithm | 4.2 | 3.6 | 3.7 |
|
Table 5. Median angular errors for multiple light sources dataset for different illumination estimation algorithms(°)
Dataset | Without segmentation | With segmentation |
---|
Mean | Median | Trimean | Max | | Mean | Median | Trimean | Max |
---|
Original ColorChecker | 5.3 | 3.7 | 4.0 | 32.5 | 5.1 | 3.4 | 3.8 | 28.5 | Re-processing of ColorChecker | 2.6 | 2.0 | 2.1 | 18.6 | 2.5 | 1.8 | 2.0 | 17.9 | SFU Grey-ball | 4.4 | 3.2 | 3.5 | 45.9 | 4.2 | 3.0 | 3.4 | 43.0 |
|
Table 6. Angular errors for the proposed method with and without segmentation(°)
Dataset | Without segmentation | With segmentation |
---|
Estimation | | Segmentation+Estimation |
---|
Original ColorChecker | 0.9 | 6.3+89.3 | Re-processing of ColorChecker | 1.2 | 41.1+183.8 | SFU Grey-ball | 23.2 | 1.0+164.3 |
|
Table 7. Average consuming time for the proposed method with and without segmentations