
Yuchen Sun, Yuhong Liu, Dafeng Zhang, Rongfen Zhang. Diagnosis Method of Diabetic Retinopathy Based on Deep Learning[J]. Laser & Optoelectronics Progress, 2020, 57(24): 241701
- Laser & Optoelectronics Progress
- Vol. 57, Issue 24, 241701 (2020)
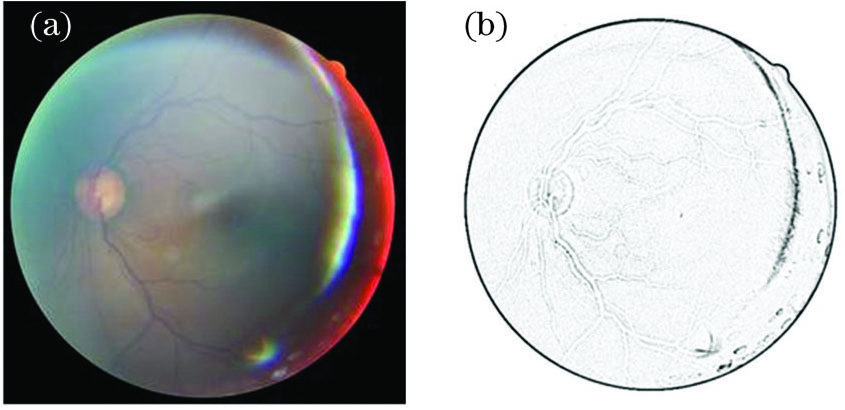
Fig. 1. Original healthy retinal fundus image and image after edge detection. (a) Original healthy retinal fundus image;(b) image after edge detection
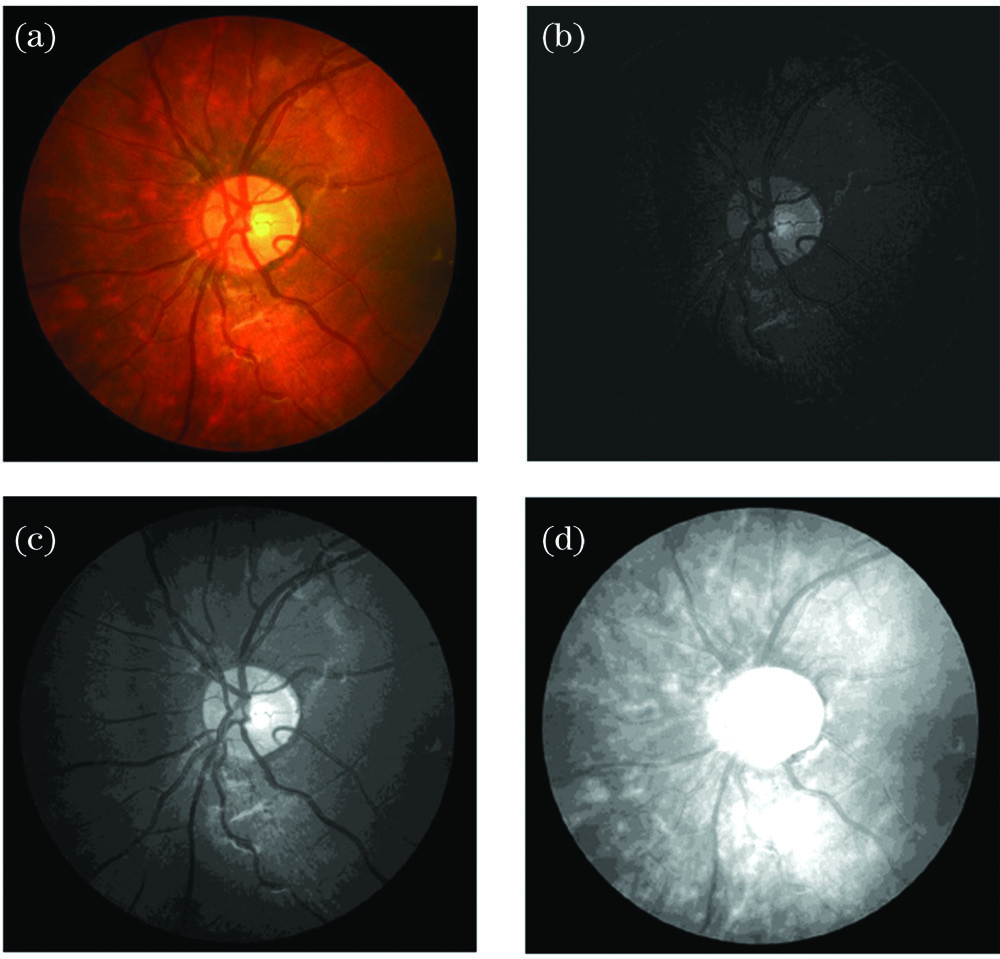
Fig. 2. Original image, and components of B, G, and R channels. (a) Original image;(b) B channel component;(c) G channel component; (d) R channel component
Fig. 3. Original neural network structure, and network structure with Dropout. (a) Original neural network structure; (b) network structure with Dropout
Fig. 4. Transformed dataset image
Fig. 5. Residual module
Fig. 6. Traditional Inception module
Fig. 7. Bottleneck structure of 1×1
Fig. 8. Optimized Inception module
Fig. 9. Inception module with ResNet
Fig. 10. Sigmoid function and ReLU function. (a) Sigmoid function; (b) ReLU function
Fig. 11. Loss and average accuracy curves of training with DetectionNet model. (a) Average accuracy; (b) loss
|
Table 1. Classification of fundus images of diabetic retinopathy
| |||||||||||||||||||||||||||||||||||||||||||||||
Table 2. Recognition results of retinal fundus images of five lesion grades
|
Table 3. Comparison of accuracy of different network models

Set citation alerts for the article
Please enter your email address
© Copyright 2018-2021 | Chinese Laser Press. All Rights Reserved 沪ICP备15018463号-20