• Journal of Geographical Sciences
  • Vol. 30, Issue 7, 1060 (2020)
Xueqin WANG1、2、3, Shenghe LIU1、2、*, and Wei QI1、2
Author Affiliations
  • 1Institute of Geographic Sciences and Natural Resources Research, CAS, Beijing 100101, China
  • 2College of Resources and Environment, University of Chinese Academy of Sciences, Beijing 100049, China
  • 3School of Geography, Beijing Normal University, Beijing 100875, China
  • show less
    DOI: 10.1007/s11442-020-1770-3 Cite this Article
    Xueqin WANG, Shenghe LIU, Wei QI. Mega-towns in China: Their spatial distribution features and growth mechanisms[J]. Journal of Geographical Sciences, 2020, 30(7): 1060 Copy Citation Text show less
    Divisions of administrative units and economic zones in China
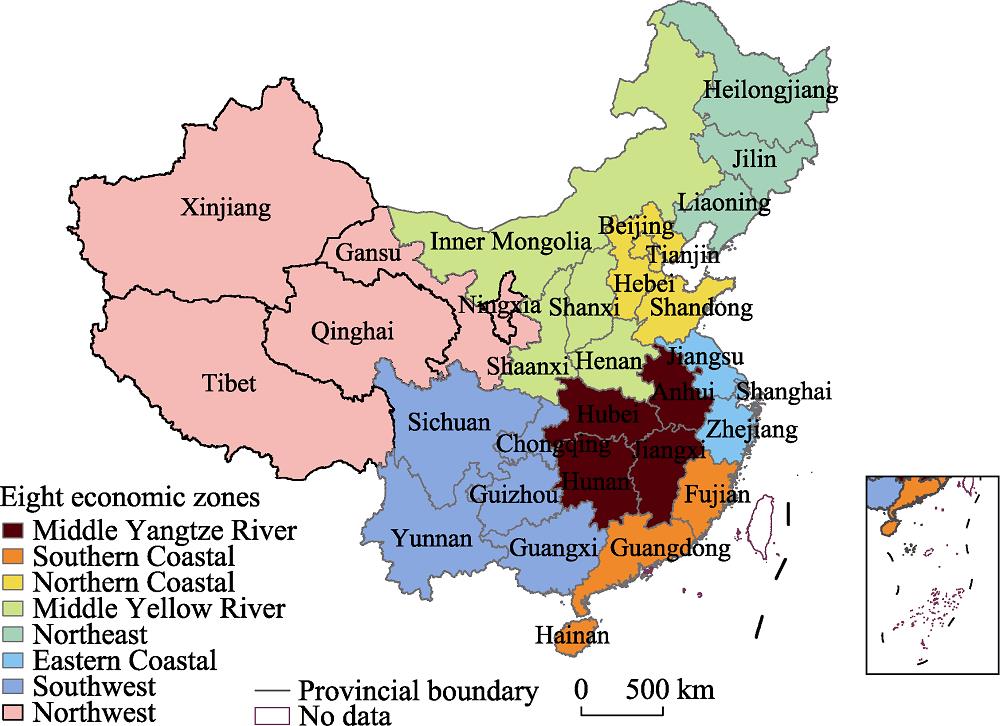
    Fig. 1. Divisions of administrative units and economic zones in China
    Spatial distributions of China's mega-towns in 2015
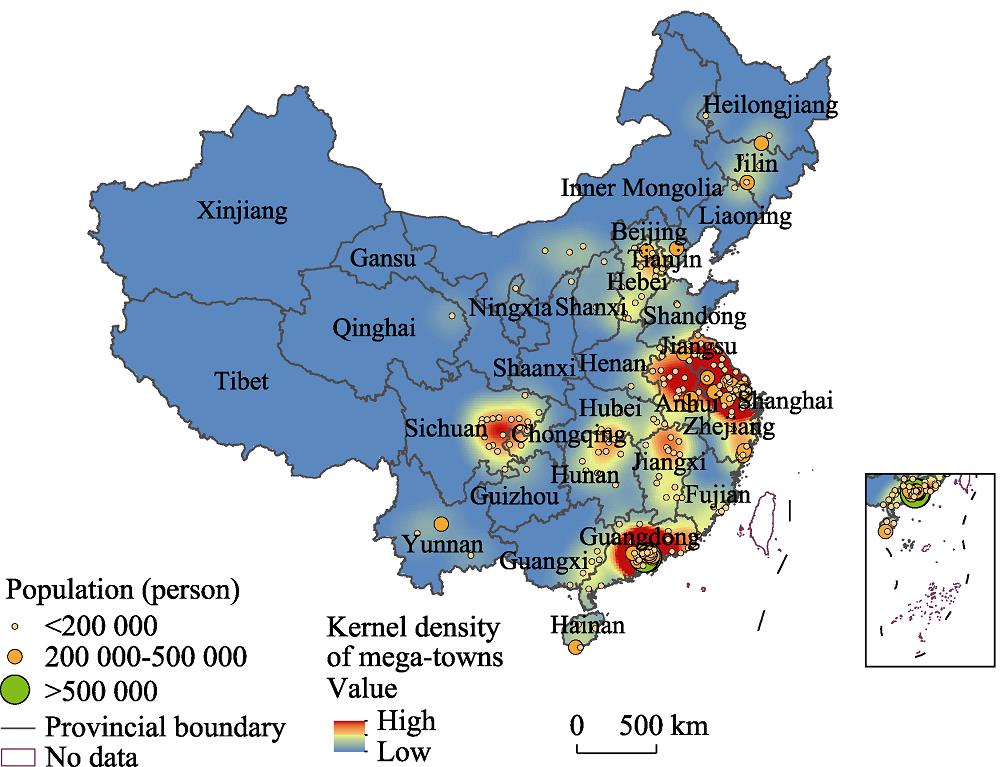
    Fig. 2. Spatial distributions of China's mega-towns in 2015
    Mega-towns' contribution to eight economic zones of China in 2015
    Fig. 3. Mega-towns' contribution to eight economic zones of China in 2015
    Line fit plot of various influencing factors on the number of mega-towns (Y) in 2015
    Fig. 4. Line fit plot of various influencing factors on the number of mega-towns (Y) in 2015
    Local autocorrelation analysis of DEM in China in 2015
    Fig. 5. Local autocorrelation analysis of DEM in China in 2015
    Local autocorrelation analysis of location in China in 2015
    Fig. 6. Local autocorrelation analysis of location in China in 2015
    Local autocorrelation analysis of economic density in China in 2015
    Fig. 7. Local autocorrelation analysis of economic density in China in 2015
    Local autocorrelation analysis of population density in China in 2015
    Fig. 8. Local autocorrelation analysis of population density in China in 2015
    Local autocorrelation analysis of highway density in China in 2015
    Fig. 9. Local autocorrelation analysis of highway density in China in 2015
    Growth mechanisms of China's mega-towns
    Fig. 10. Growth mechanisms of China's mega-towns
    Mega-townInhabitants (person)NumberList
    Medium city level≥500,0002Chang'an Omitted, Humen Town
    Type-I small city level200,000-500,00037Tangxia Town, Houjie Town, Liaobu Town, Changping Town, Dachang Town, Xiaolan Town, Fenggang Town, Dalang Town, Qingxi Town, Qibao Town, Xinzhuang Town, Xucheng Town, Taihu Lake New Town, Dalingshan Town, Longgang Town, Yangshe Town, Yushan Town, Beiqijia Town, Suicheng Town, Tianya Town, Zhili Town, Shijie Town, Nanqiao Town, Qian'an Town, Huangjiang Town, Gucun Town, Sanlin Town, Meilong Town, Wucheng Town, Wuchang Town, Gaobu Town, Jiuting Town, Tangxia Town, Hengli Town, Licheng Town, Shishan Town
    Type-II small city level100,000-200,000199Omitted
    Table 1.

    China's mega-towns listed by scale hierarchies in 2015

    RegionsGDP (billion)Urbanization rate (%)Inhabitants (billion)
    Eastern Coastal Area13812.673.3159.3
    Northern Coastal Area13236.169.4209.9
    Southern Coastal Area10249.562.1156.0
    Middle Yangtze River9718.252.5233.5
    Southwest Area8669.548.2242.9
    Middle Yellow River8562.254.0194.5
    Northeast Area5781.660.5109.5
    Northwest Area2247.044.865.4
    Table 2.

    Socio-economic situation of eight comprehensive economic zones in 2015

    RegionNumber of mega-townsrRegionNumber of mega-townsr
    Eastern Coastal Area720.83Southwest Area290.70
    Northern Coastal Area170.71Middle Yellow River90.70
    Southern Coastal Area570.82Northeast Area80.69
    Middle Yangtze River440.84Northwest Area20.64
    Table 3.

    Regional nearest neighbour distance index r of China's mega-towns in 2015

    Province-level regionNumber of mega-townsrDistribution modeProvince-level regionNumber of mega-townsrDistribution mode
    Beijing10.00agglomerationGuangdong480.83agglomeration
    Guizhou10.00agglomerationJiangxi130.86agglomeration
    Liaoning10.00agglomerationHunan90.87agglomeration
    Ningxia10.00agglomerationTianjin30.89agglomeration
    Qinghai10.00agglomerationHeilongjiang30.95agglomeration
    Shaanxi10.00agglomerationAnhui151random
    Shandong20.07agglomerationYunnan31.08uniform
    Inner Mongolia30.38agglomerationJiangsu351.15uniform
    Guangxi50.63agglomerationHenan31.18uniform
    Jilin40.64agglomerationHebei111.32uniform
    Hubei70.70agglomerationHainan41.41uniform
    Sichuan180.70agglomerationShanxi22.15uniform
    Chongqing20.71agglomerationGansu0
    Zhejiang140.72agglomerationTibet0
    Shanghai230.75agglomerationXinjiang0
    Fujian50.81agglomerationChina2380.48agglomeration
    Table 4.

    Provincial nearest neighbour distance index r of China's mega-towns in 2015

    Xueqin WANG, Shenghe LIU, Wei QI. Mega-towns in China: Their spatial distribution features and growth mechanisms[J]. Journal of Geographical Sciences, 2020, 30(7): 1060
    Download Citation