Xueqin WANG, Shenghe LIU, Wei QI. Mega-towns in China: Their spatial distribution features and growth mechanisms[J]. Journal of Geographical Sciences, 2020, 30(7): 1060
Copy Citation Text
As a special outcome of urbanization, mega-towns not only play an important role in the process of socio-economic development, but also are important contributors to urbanization. Based on a spatial database of mega-towns in China, this paper explores the spatial distribution features and growth mechanisms of China’s 238 mega-towns using the nearest neighbour distance method, kernel density estimation, regression analysis, global autocorrelation, local autocorrelation and other spatial analysis methods. Results of spatial distribution features show that: (1) on the national scale, the existing 238 mega-towns mainly gathered in the southeast coastal areas of China; they formed two spatial core agglomerations, several secondary ones and a southeast coastal agglomeration belt; (2) on the regional scale, each economic region’s index was less than 1, indicating that mega-towns in each region tended to be spatially agglomerated due to the close relationship with regional development level and their number; (3) on the provincial scale, 68% of provincial-level units in China tended to be a spatial agglomeration of mega-towns; only one province had a random distribution; the number of mega-towns in those evenly-distributed provinces was generally small. The growth of mega-towns was determined by a combination of various natural and humanistic factors, including topography, location, economy, population, traffic, and national policy. This paper chose digital elevation model (DEM), location advantage, economic density, population density, and highway density distribution as corresponding indicators as quantitative factors. By combining their local autocorrelation analysis, these factors all showed certain influence on the spatial growth of mega-towns and together scheduled it. In the future, provinces and cities should make full use of the mega-town functions to promote their socioeconomic development, especially the central and western regions in China.
Acting as “networking 'nodes'” (Courtney and Errington, 2000), rural “growth poles” (Courtney et al., 2007), or “growth engines” (Giffinger and Kramar, 2012), towns not only build a bridge between social community capital and ecological cultural heritage, but also promote the new growth and creativity of the cities (Vaz and Nijkamp, 2013). In various areas of Europe, New Zealand, Australia, North America, etc., towns account for a significant fraction of the total population (Mayer and Knox, 2010). For instance, nearly 70% of the total population in Germany is distributed in small towns, which are also an integral part of the Asian urban system, such as Japan, China, and so forth. China is the largest developing country in the world with a huge number of small farmers and rapid urbanization; its small town's development has long been considered as an urbanization model with Chinese characteristics, which can satisfy the growing needs for urban populations and lift the living quality of urban and rural dwellers. During 1982-2015, the population of China's small towns increased from 47.4 million to 322.12 million, whose proportion in the total urban population rose from 29.6% to 41.8%, making great contributions to the urbanization.
Mega-town is a special form of socio-economic development that often emerges in the process of rural industrialization and urbanization (Wei, 2018). China's mega-town represents the highest development level of small towns, which is an administrative town with more than 100,000 inhabitants in the township; its functional form, population density, and urbanization level often reach or even exceed the general level of small and medium-sized cities (Xie et al., 2016; Wei and Fan, 2014). Those mega-towns are mainly concentrated in economically developed areas along the eastern coast (Lu, 2018), as well as the surrounding areas of some megacities and regional central cities. Mega-towns around the metropolis are an indispensable part of the metropolitan area. Besides, a mega-town where a county town is located often works as the heart of the county's social economy and culture; thus, its stable development is conducive to the sustainable growth of the county. Another kind of mega-town with professional industries plays a significant role in the local economic division due to the construction of a cluster of characteristic industries with considerable scale and competitiveness (Xie et al., 2016).
China has a huge land mass, and its natural background conditions and socio-economic levels among various regions are distinct (Liu et al., 2019), leading to obvious regional differences of mega-towns. In general, there are far more mega-towns in Southeast China than in Northwest China, and more in developed regions than in less developed regions. However, the current specific spatial differentiation characteristics remain unknown. In addition, mega-towns are not just limited to developed regions, they also appear in underdeveloped areas, such as Yunnan and Jilin provinces. What is the mechanism behind this phenomenon, or what is the growth mechanism of mega-towns? The current academic studies on mega-towns mostly focus on the strategy of mega-town power-expansion and upgrading, failing to pay attention to these two issues. Practically, the exploration of spatial distribution features and growth mechanisms of mega-towns is conducive to provide a guide for the country and local governments to grasp the characteristics and laws of mega-town's spatial differentiation, formulating a scientific development path for mega-towns.
Based on the systematic construction of a spatial database of China's mega-towns, this paper aims to explore the above two questions to lay a foundation for promoting their sustainable development. Using the nearest neighbour distance and kernel density estimation methods, we analysed mega-town's spatial distribution pattern, examining their national and regional differences. Furthermore, by combining Excel software with ArcGIS software, regression analysis and spatial autocorrelation method were applied based on the overlapping spatial elements, to quantitatively analyse the growth mechanism of mega-towns from topography, location, economy, population, road traffic and other five aspects. Besides, national policy was selected to qualitatively analyse the growth mechanism. This research can also provide certain reference for other developing countries.
2 Key literature review
According to the World Urbanization Prospects: The 2018 Revision, approximately half of the world's urban dwellers reside in settlements with fewer than 500,000 inhabitants (UN, 2018). Yet, these small settlements are often neglected in the national policy, slipping through the net between urban strategies and policies for disadvantaged rural regions (Mayer and Knox, 2010). Even in the international context, the main-stream studies on urban studies paid most of the attention to big cities (Bjelland, 2010), rather than small settlements (Guin, 2019). However, Bell and Jayne (2009) argued that the exclusive focus on the biggest cities limits the generalizability of these grand theories, and inhibits the development and impact of urban studies in the broadest sense. Many other researchers (Lacour and Puissant, 2007; Ofori-Amoah, 2007) also highlighted the need for urban research which would be free from “sizism”; those investigations have successfully promoted the studies agenda of small and medium-sized cities. For example, numerous studies on small towns have been conducted in Serbia, and a stream of research in India has emerged recently focusing on various aspects of small urban centres which Zerah and Denis (2017) termed as “second urban turn”. Indeed, small towns offer unique opportunities for residents to collectively fashion alternatives to the forces of neoliberal globalization (Knox and Mayer, 2009). They also play a critical role in rural development especially in culture-led rural place-making in their micro-regions (Csurgó and Megyesi, 2016) and exchanges between rural and urban households, enterprises and economies (Spasić and Petrić, 2006).
Currently, the concept of small towns has not been clearly defined. Based on the availability of town data, many countries or current studies often applied a rather simple definition of towns as settlements with a certain population size, which was non-uniform due to different population thresholds of small towns among various countries (Ploeckl, 2017). Germany defines those with fewer than 5000 inhabitants as small towns, so does Russia, while the scale of small cities in the United States is fewer than 50,000 (Brennan et al., 2005), and communities with 200 people can be set as towns. Some developing countries define settlements with inhabitants of 5000 up to 20,000 as small cities (Bell and Jayne, 2009). The medium-sized town is usually a town with a population between 20,000 and 200,000, depending on population density and the respective urban system in a country (Rivkin and Rivkin, 1982; Rondinelli, 1983; European Foundation, 1994). In many other areas of the world, population size might not be a simple determinant criterion. In India, a large village might contain several times as many people as a small town. In the United Kingdom, there are many towns that are far larger than some historical cities; some forms of non-rural settlements, such as temporary mining locations, may be clearly non-rural, but have at best a questionable claim to be called a town. China sets towns based on certain indicators such as population, economy, industrial structure, etc. The population requires more than 10,000, and there is no upper limit.
As a special kind of town in the world, mega-town's population and functional form often reach or even exceed the general level of cities. This is closely related to national standards for setting up towns and cities. For instance, a British town can evolve into a city when three main criteria are satisfied: “a minimum population of 300,000”, “a record of good local government” and “a 'local metropolitan character'”. Sometimes, it also involves other factors, such as the results of democratic elections, government ruling standards, etc. So far, a number of large towns (such as those with over 200,000 residents) have existed in the UK, which cannot legitimately call themselves a city without the royal designation. Similarly, 238 mega-towns are formed in China, which refers to a town with more than 100,000 inhabitants in the township according to National Report on the New Urbanization in 2015 (NDRC, 2015).
Mega-towns in most foreign countries rarely have conflicts and problems between management and development, as the local governments have autonomous rights on lawmaking, financial allocation, infrastructure construction, and other aspects. Therefore, foreign research on mega-towns is relatively limited, mainly about development processes, social issues, land uses, etc. For instance, Kate (2016) explored the development process for mega townships in India, emphasizing the focus on meeting the demands of lower and weaker economic sectors and implementations of legislations and policies, to achieve inclusive development in India; D'Aeth (1914) made an analysis on social organization of large towns, and found that a large town is not a single social unit (i.e. it is not a single set of social institutions involving churches, public halls, debating societies, etc.); Snowden and Pridemore (2013) examined the direct and moderating effects of alcohol outlet density, social disorganization, and land use on violence in a large college town.
In view of the non-municipal self-government systems in China, mega-towns have certain particularity and restrictive nature: they have more responsibility but less power, which drives them into a dilemma of weak function and low efficiency (Émile, 2000). Therefore, a large amount of literature discussed solutions to solve this issue, the core way of which is the power expansion or upgrading of mega-towns (Huang et al., 2016; Ding, 2015; Gu, 2017). Among them, discussions on the spatial distribution and growth mechanism of mega-towns are almost blank. In addition, most of the current research belonged to the macro qualitative discussion, and specific empirical studies mostly focused on a certain province or city. More attention should be paid to quantitative research on the whole national scale.
3 Data and methods
3.1 Study area and data
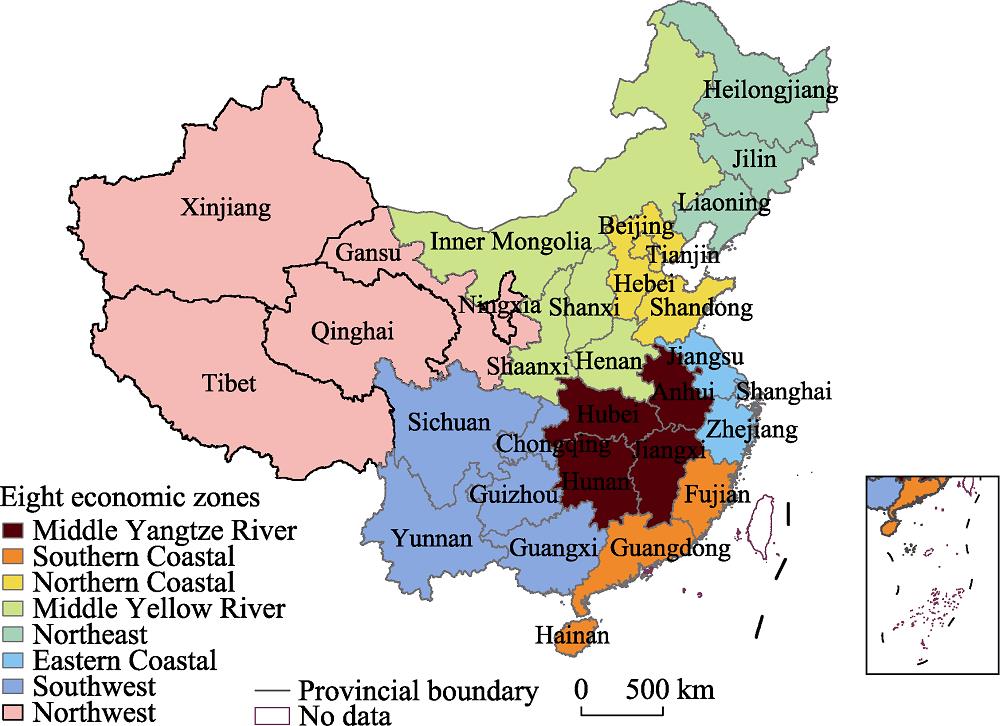
China is located in East Asia on the west coast of the Pacific. It has 34 provincial administrative regions (Hong Kong, Macao, and Taiwan are excluded due to the lack of data), as shown in Figure 1. Since 2014, the National Bureau of Statistics of China has released China's County Statistical Yearbook (township volume) every year, and the China National Knowledge Internet has announced the corresponding electronic versions (http://data.cnki.net/Yearbook/Navi?type=type&code=A), mainly involving administrative areas, working population, industrial output value, built-up areas, inhabitants, and inhabitants in urban built-up areas. This study collected town data in 2015 compiled in the 2016 yearbook, and then selected data of those 238 mega-towns. The basic vector information data used in this study, such as world vector surface data, China vector surface data, and China DEM raster data, were all sourced from the Resource and Environmental Science Data Center of the Chinese Academy of Sciences. The vector point data of China's mega-towns in 2015 was produced by geographic information technology such as latitude and longitude data capture and digitization, based on China's Township Administrative Divisions. In addition, the GDP and inhabitants data of cities across the country were from the annual statistical yearbooks of the corresponding provinces and cities.
Figure 1.
Divisions of administrative units and economic zones in China
The nearest neighbour distance is the distance between any point and its nearest neighbour, indicating the extent of geographical proximity between points in geographic space. The nearest neighbour index is mainly analysed by the average distance between a point and its nearest neighbour, and the expected average distance of hypothetical random distribution, to determine whether the point is randomly distributed or concentrated. The specific calculation method is as follows:
where di is the actual nearest neighbour distance; ${{d}_{e}}$ represents the theoretical average nearest distance; N is the total number of points; A indicates the area of the study area; r represents the nearest neighbour distance index. According to the r value, three distribution modes can be judged: r>1 means that the actual nearest neighbour distance between points is larger than the theoretical nearest neighbour distance, indicating that points are mutually exclusive and tend to be in spatially uniform distribution; r=1 refers to the distribution of illustrated points which belong to the spatial random distribution; r<1 indicates that the actual nearest neighbour distance between points is smaller than the theoretical one, showing that points tend to be spatial agglomeration distribution. By measuring the r value of mega-towns, this study macroscopically analyses distribution features of mega-towns across the country, different economic regions and different provinces.
3.2.2 Kernel density estimation
The kernel density estimation (KDE) method mainly uses a moving cell to estimate the density of points or line patterns. It is to study the distribution characteristics of points by examining the spatial changes of point density in a regular area, whose calculation formula can be expressed as:
where f(x) is the kernel density calculation function at the spatial position x; d is the dimension of space; h is the distance attenuation threshold, i.e., bandwidth; N is the number of points whose distance from the position xi is less than or equal to h; K function represents the spatial weight function.
Spatial analysis tools of ArcGIS software can realize the KDE method and perform spatial visualization of results. This study uses the KDE method to estimate the spatial density of 238 mega-towns in China, and analyses the overall spatial distribution characteristics of mega-towns on the national scale.
3.2.3 Regression analysis
Regression analysis is a method of analysing the linear correlation between one independent variable x and the dependent variable y, to judge whether there is a correlation between the independent variable and the dependent variable. When there is only one independent variable in the regression analysis, it is called univariate linear regression; when there are two or more, it is called multiple linear regression. This study intends to adopt the univariate linear regression, whose regression equation is as follows:
where y is the dependent variable; x is the independent variable; a represents intercept of the regression equation and b is the slope of the equation; $\bar{x}$ and $\bar{y}$ are namely average values of x and y.
$R=\frac{\Sigma xy-\bar{x}\Sigma y}{\sqrt{\left( \Sigma {{x}^{2}}-\bar{x}\Sigma x \right)\left( \Sigma {{y}^{2}}-\bar{y}\Sigma y \right)}}$
where R is the correlation coefficient, whose value range is [-1, 1]. R= -1 means absolute negative correlation; R=0 indicates absolute irrelevance; R=1 represents absolute positive correlation. The bigger the absolute value of R is, the higher the degree of correlation will be. In addition, the linear regression will detect whether the regression model is effective through reference coefficient p value computed by corresponding software. p<0.001 means extremely significant; 0.001<p<0.01 represents very significant; 0.01<p<0.05 indicates generally significant; and p>0.05 means not significant.
This study is to judge the correlation between each factor and the growth of mega-towns, by using each factor's data to conduct the regression analysis with the number of mega-towns, laying a foundation for spatial autocorrelation analysis.
3.2.4 Spatial autocorrelation
Spatial autocorrelation analysis is an analytical method that tests whether a unit's observations are correlated with its neighbour's observations (Sridharan et al., 2007), including global autocorrelation and local autocorrelation. The global autocorrelation is usually measured by Moran's I index (Cliff and Ord, 1972), so as to reveal the overall distribution of the spatial unit's observations and to determine whether there are spatial agglomerations or outliers at the global level. The formula is as follows:
where xi and xj are observation values of area units i and j, and i is not equal to j; N means the number of area units; wij represents the space weight matrix. Moran's I index is always between -1 and 1. Moran's I > 0 indicates that the unit's observations are spatially agglomerated; Moran's I < 0 represents observations are discretely distributed; Moran's I = 0 means observations are randomly distributed.
Local autocorrelation is to reveal the similarity or heterogeneity between observations of adjacent spatial units in the study area. It can quantitatively identify the distribution of “hot spot, cold spot” of a certain attribute of area, and then detect the spatial pattern of regional polarization. The formula of the local Moran's I (LMI) index is expressed as follows:
where Zi and Zj represent the normalized values of observation values of i and j spatial units; Wij is the spatial weight matrix. The LMI index can reflect a clustering relationship between a certain observation value and its surrounding observation values, including four types: high and high cluster (High-High) indicates the attribute value of observation is high with the surroundings; high and low cluster (High-Low) means the attribute value of observation is high while the periphery is low; low and high cluster (Low-High) means the attribute value of observation is low, but the surrounding is high; low and low cluster (Low-Low) indicates the attribute value of observation is low with the periphery, and the last one means that there is no obvious clustering mode.
Global autocorrelation and local autocorrelation methods are mainly used to analyse the spatial growth mechanism of mega-towns. Among them, this paper chose global autocorrelation to determine whether each relevant factor of mega-towns was spatially agglomerated. Further, this research adopted local autocorrelation to analyse the spatial distribution characteristics of various factors. By comparing and analysing the consistency or similarity between the spatial distribution features of factors and that of mega-towns, this paper further explored the influence mechanism of related factors on the growth of mega-towns.
4 Results
4.1 National scale
As shown in Table 1, there were 238 mega-towns with a population of more than 100,000 in China in 2015, which only accounted for 1.18% of the whole small towns while their total population occupied 11.82%. The total number of residents in the mega-towns was more than 38 million, which indicates that China's mega-towns are important contributors to urbanization.
Based on formula (1) and ArcGIS software, the theoretical nearest neighbour distance of China's mega-towns is 99,828.3 m, and the nearest neighbour index r is 0.48. This shows that the actual nearest neighbour distance between mega-towns is smaller than the theoretical nearest neighbour distance, thus implying that the distribution of mega-towns belongs to a spatial agglomeration pattern.
To further analyse the spatial concentration characteristics of mega-towns, this study obtained the kernel density of mega-towns characterizing the spatial distribution pattern of mega-towns based on kernel density estimation method, as shown in Figure 2. According to the kernel density figure (Figure 2), we found several features as follows:
Figure 2.
Spatial distributions of China's mega-towns in 2015
(1) The overall distribution of China's mega-towns was a pattern of “sparse in the Northwest and dense in the Southeast”. From Figure 2, it can be seen that there were fewer mega-towns in the Northwest and their distribution was sparse. Specifically, there were no mega-towns in Gansu, Xinjiang, Tibet and other provinces. Comparatively, large numbers of mega-towns were located in the Southeast China, and they were relatively spatially agglomerated, especially in the most densely populated and economically advanced southeast coastal region in China. This reflected the spatial characteristics of China's mega-towns: they gathered in the southeast coastal areas of China.
(2) Mega-towns formed two spatial core agglomerations and several secondary ones. The two core clusters were namely the Yangtze River Delta urban cluster and the Pearl River Delta urban cluster, where both the number and population size of these mega-towns were relatively large. The two medium-city-level mega-towns were both concentrated in the Pearl River Delta region, where the total number of mega-towns was 34, which accounted for 14.3% of all mega-towns. The Yangtze River Delta region had 65 mega-towns, which made up a relatively significant share (27.3%) of mega-towns. Among them, there were 12 mega-towns with a population of over 200,000, including Dachang Town, Qibao Town, Xinzhuang Town, etc. There were secondary clusters which were mainly distributed in the Beijing-Tianjin-Hebei urban agglomeration, the Sichuan Basin, the central area of Hunan and Hubei, and the central area of Guizhou. These secondary clusters had a relatively large number of small-sized mega-towns with a contiguous distribution. It can be seen that the spatial agglomeration features of China's mega-towns were comparatively remarkable.
(3) A southeast coastal agglomeration belt of mega-towns has formed. China's southeast coastlands had a prominent geographical location advantage, rapid economic development, and a high level of urbanization. Production factors in these areas such as labour, capital, technology, etc., were highly concentrated, which provided unique conditions for the growth and development of mega-towns. A number of mega-towns have already grown up in the coastal strip from the eastern part of Jiangsu Province to Hainan Island, forming a coastal belt.
4.2 Regional scale
According to features of socio-economic development in various regions, China's national land space is divided into eight comprehensive economic zones, as shown in Table 2.
Regions
GDP (billion)
Urbanization rate (%)
Inhabitants (billion)
Eastern Coastal Area
13812.6
73.3
159.3
Northern Coastal Area
13236.1
69.4
209.9
Southern Coastal Area
10249.5
62.1
156.0
Middle Yangtze River
9718.2
52.5
233.5
Southwest Area
8669.5
48.2
242.9
Middle Yellow River
8562.2
54.0
194.5
Northeast Area
5781.6
60.5
109.5
Northwest Area
2247.0
44.8
65.4
Table 2.
Socio-economic situation of eight comprehensive economic zones in 2015
This study counted the number of mega-towns in each area and summarized the economic contribution and demographic contribution of mega-towns to the corresponding region, as shown in Figure 3. In view of the data availability, industrial output represented economic contribution. In general, the more developed the regional economy and the higher urbanization ratio of areas were, the more mega-towns there were, the greater the economic contribution and population contribution of mega-towns to areas were. However, the northern coastal area was rather special and ranked 2nd in terms of economic strength and urbanization in all regions, but both the number of mega-towns and contribution ranked 5th. This might be due to the fact that the development of this area mainly relies too much on the dual-core of “Beijing dominates and Tianjin supplements”. In comparison, most surrounding areas like Tangshan, Chengde, etc., of Hebei Province were backward. The excessive distribution of production factors was not conducive to the balanced growth of mega-towns.
Figure 3.
Mega-towns' contribution to eight economic zones of China in 2015
In addition, this study recorded the nearest neighbour distance indexes of mega-towns of eight economic regions, as shown in Table 3. Each economic region's index was less than 1, indicating that mega-towns in each region tend to be a spatial agglomeration distribution.
Region
Number of mega-towns
r
Region
Number of mega-towns
r
Eastern Coastal Area
72
0.83
Southwest Area
29
0.70
Northern Coastal Area
17
0.71
Middle Yellow River
9
0.70
Southern Coastal Area
57
0.82
Northeast Area
8
0.69
Middle Yangtze River
44
0.84
Northwest Area
2
0.64
Table 3.
Regional nearest neighbour distance index r of China's mega-towns in 2015
Table 3 also shows that the spatial concentration of mega-towns shows an inverse relationship to the degree of regional development and the number of mega-towns in general. As regional development levels decreased and the number of mega-towns dropped, the degree of spatial agglomeration increased on the whole. For instance, the eastern coastal area and the southern coastal area were the two most developed economic zones in China, and they had the most mega-towns accounting for 54.2% of the total, while the spatial concentration levels of their mega-towns ranked second to last and third to last among eight economic zones. Their r values were 0.83 and 0.82, respectively. The socio-economic levels of northeast and northwest areas were the two lowest regions while conditions of their spatial agglomeration ranked the highest. This was closely related to China's natural resource and environmental distribution differences. The resource endowment conditions in China's economically developed regions are usually better and relatively uniform, which is conducive to the growth and scattered distribution of mega-towns. Comparatively, China's underdeveloped areas are usually those with complex terrain and relatively scarce resources, such as the Northwest and Southwest. Furthermore, their conditions to support the development of mega-towns are usually limited and concentrated, so that the number of mega-towns is small and the distribution is relatively concentrated. Using the Northwest Area as an example, its natural resources were extremely scarce and their natural environment was overly harsh, which negatively impacted regional development and growth of mega-towns. In addition, the scarce resources are relatively concentrated in the Northeast China Plain, therefore, a limited number of mega-towns are densely distributed in the Songliao Plain.
4.3 Provincial scale
Based on data availability, the following analysis did not include Hong Kong, Macao, and Taiwan. This study counted the number of mega-towns in 31 provincial administrative units and calculated their nearest neighbour distance index r. The results are shown in Table 4. We found that:
Province-level region
Number of mega-towns
r
Distribution mode
Province-level region
Number of mega-towns
r
Distribution mode
Beijing
1
0.00
agglomeration
Guangdong
48
0.83
agglomeration
Guizhou
1
0.00
agglomeration
Jiangxi
13
0.86
agglomeration
Liaoning
1
0.00
agglomeration
Hunan
9
0.87
agglomeration
Ningxia
1
0.00
agglomeration
Tianjin
3
0.89
agglomeration
Qinghai
1
0.00
agglomeration
Heilongjiang
3
0.95
agglomeration
Shaanxi
1
0.00
agglomeration
Anhui
15
1
random
Shandong
2
0.07
agglomeration
Yunnan
3
1.08
uniform
Inner Mongolia
3
0.38
agglomeration
Jiangsu
35
1.15
uniform
Guangxi
5
0.63
agglomeration
Henan
3
1.18
uniform
Jilin
4
0.64
agglomeration
Hebei
11
1.32
uniform
Hubei
7
0.70
agglomeration
Hainan
4
1.41
uniform
Sichuan
18
0.70
agglomeration
Shanxi
2
2.15
uniform
Chongqing
2
0.71
agglomeration
Gansu
0
—
—
Zhejiang
14
0.72
agglomeration
Tibet
0
—
—
Shanghai
23
0.75
agglomeration
Xinjiang
0
—
—
Fujian
5
0.81
agglomeration
China
238
0.48
agglomeration
Table 4.
Provincial nearest neighbour distance index r of China's mega-towns in 2015
(1) Mega-towns of most provincial-level units in China tended to be in spatial agglomeration distribution, but degrees of agglomeration were not high. Table 4 shows that there were 21 provinces and cities whose r value was less than 1, accounting for 68% of the total provincial units. Their administrative areas shared 53.4% of the whole land. According to the results, the r values of 6 in the 21 provinces were 0.00 because only 1 mega-town existed in them, while 13 provinces had an r value greater than 0.6. As a larger r value means a smaller degree of agglomeration, the concentration level of most provincial units is low. The reason might be that mega-towns usually surround the periphery of metropolis so that the distance between the mega-towns is relatively large, and the area of provincial administrative units is much smaller compared with economic zones. According to the calculation formula of nearest neighbour distance, the r value will not be small which means concentration degree will not be high.
(2) Only one province had a random distribution of mega-towns. Based on calculation results, Anhui Province was the only province among all provincial units, whose nearest neighbour distance index r was 1, implying that the spatial distribution of 15 mega-towns in this province belonged to a random distribution. This means that the spatial distribution of mega-towns in Anhui was not affected by the differences in regional socio-economic development (Peng and Yang, 2018).
(3) The number of mega-towns in those provinces where mega-towns were evenly distributed was generally small. Table 4 shows that there were six provinces with uniformly distributed mega-towns, and among them, four provinces including Hainan, Henan, Yunnan, and Shanxi, had less than four mega-towns (2, 3, 3, and 4, respectively). The reason for this phenomenon needs to be further explored.
5 Analysis of growth mechanisms of mega-towns
The spatial growth of mega-towns is a result of the combination roles of many influencing factors. Considering natural factors and regional natural resources, terrain and environment play fundamental roles in the development and growth of urban settlements by affecting production efficiency, life quality and ecological protection. With regard to humanistic and social factors, regional economic development conditions, population distribution, geographical location, infrastructure level and government policy, etc. all have an important effect on the growth of mega-towns. According to the principles of correlation factor typicality, data availability, and operability, this study selected five aspects to complete a quantitative analysis on growth mechanisms of China's mega-towns, involving topography, location, economic development, population concentration degree, and traffic. Meanwhile, the national policy factor was chosen for the qualitative analysis.
In terms of quantitative analysis, this study would take a regression analysis to judge the correlation between the selected influencing factors and the number of mega-towns. This study used each factor's indicator data to make regression analysis with mega-towns. By determining those factors that are related to the number of mega-towns according to the result of regression analysis, this study will continue to perform spatial autocorrelation analysis to analyse in-depth the specific impact of factors on the spatial growth of mega-towns.
With regard to qualitative analysis, this paper will analyse the impact of national policy factors on the spatial growth of mega-towns.
Finally, this study will summarize the growth mechanism of China's mega-towns by comprehensively sorting out the results of qualitative and quantitative analysis.
5.1 Quantitative factor analysis
5.1.1 Regression analysis
This paper applied digital elevation model (DEM) indicator to characterize terrain; the distance between a mega-town and its neighbouring core city was indicative of the location advantage level of the mega-town; economic density represented the degree of regional economic development; population density indicated the regional population concentration degree; highway network density characterized the level of regional road traffic convenience. One thing to note, there were 90 core cities consisting of 34 provincial capital cities and 56 prefecture-level cities above the scale of a large city, whose urban resident population was over 1 million. In addition, the economic density, population density, and highway network density data all adopted municipal-scale data. The specific data processing methods are as follows:
This paper collected national DEM raster data, vector surface data of national prefecture-level spatial units, vector point data of national prefecture-level city seats, and vector point data of the 238 mega-towns' geographical layout, vector line data of the national highway network distribution, urban GDP and resident population statistical data. This paper took the extraction tool to assign the DEM raster data to the corresponding extra-towns, to obtain the DEM vector database of mega-towns in China. Also, it measured the distance between a mega-town and its neighbouring core city, constructing the location advantage vector database. Furthermore, it calculated economic density, population density, and road network density at the prefecture-level, and built the vector databases of national municipal-scale economic density, population density, and road network density. Finally, it superimposed the three vector maps with the spatial distribution vector point map of mega-towns through the interception tool of ArcGIS, to make mega-towns obtain the local attributes including economic density, population development levels, and traffic conditions. Therefore, 238 mega-towns obtained all attributes of the five selected influencing factors.
This study used each factor's attribute data to make regression analysis with the number of mega-towns based on formulas (4)-(7), to judge the correlation between each factor and the growth of mega-towns. The results showed that the correlation coefficient R of DEM, distance from core cities, economic density, population density and highway density were respectively -0.3911, -0.4899, 0.4617, 0.6893 and 0.0708. Their reference coefficient p values were 0.0482, 0.0052, 0.0068, 0.0000 and 0.4621. Line fit plots were shown in Figure 4.
Figure 4.
Line fit plot of various influencing factors on the number of mega-towns (Y) in 2015
It denoted that there all were interrelationships between the five factors and mega-towns: (1) The economic density, population density, and highway density were positively correlated with mega-towns. Except for road density, the results of model tests were very significant, indicating that densely populated and economically developed areas were more conducive to the cultivation of mega-towns. The improvement of traffic conditions might also benefit the development of mega-towns. (2) DEM and distance from core cities both had a negative correlation with mega-towns. The DEM's model test was generally significant, and the model test of distance from the core city was very significant. This indicated that the flatter the terrain and the closer to the core city, the more conducive to the growth and development of mega-towns. Therefore, this paper determined that these five factors chosen were related to the growth of mega-towns.
5.1.2 Spatial autocorrelation analysis
To further explore the specific impact of factors on the spatial growth of mega-towns and the growth mechanism of mega-towns, this paper implemented spatial autocorrelation analysis, involving global autocorrelation and local autocorrelation.
First, using the formula (8), this paper carried out global autocorrelation processing on those influencing factors on mega-towns' growth to determine whether there were some spatial agglomeration characteristics. The results of the global autocorrelation showed that the Moran's I indexes of DEM, location advantage, economic density, population density, and highway density distribution of China's mega-towns were all greater than 0, 0.1856, 0.5215, 1.7326, 1.6358, and 0.2233, respectively. Their Z values, indicating a significant degree of spatial autocorrelation, were 16.06, 18.60, 61.45, 58.08, and 8.07, implying that these related factors all had agglomeration features in the spatial distribution, laying a foundation for local autocorrelation analysis.
Second, this paper made local autocorrelation processing on the spatial distribution of each correlation factor based on the formula (9). By further confirming whether there was consistency or similarity between each factor's concentration characteristics and mega-towns' distribution features, we analysed their influence on the spatial growth of mega-towns. The results are as follows:
(1) Terrain factor. This paper conducted local autocorrelation measures on the DEM distribution map of mega-towns in China. The results are displayed in Figure 5. It demonstrates that the mega-towns formed a High-High type agglomeration zone in Northwest China, showing that the mega-town surrounding a high-altitude mega-town also had high elevation. This type was closely related to the objective phenomenon of high altitude in Northwest China. Among them, the agglomeration feature of the Sichuan Basin was more obvious, which was one of the secondary gathering areas of mega-towns. The main reason is that Sichuan Basin has rich resources and a large number of small towns (1909, far more than those of other provinces), laying a good foundation for the development of mega-towns. However, it crossed the Qinghai-Tibet Plateau, Hengduan Mountains, Yunnan-Guizhou Plateau, and other geomorphological units, making the altitude of many mega-towns generally high and thus forming a High-High agglomeration zone. Low-Low type agglomeration zone was mainly located in Southeast China, especially in the Yangtze River Delta and Pearl River Delta regions. These areas are basically plain areas, with relatively developed economies and dense populations, which is conducive to the spatial concentration of mega-towns and the formation of Low-Low type. It can be seen that High-High type and Low-Low type agglomeration zones include almost all core clusters of mega-towns, showing a background role of natural conditions on spatial growth of mega-towns.
Figure 5.
Local autocorrelation analysis of DEM in China in 2015
In addition, this study analysed the elevation values of mega-towns and found that nine mega-towns with an altitude of over 1000 m accounted for 3.78% of the total number of mega-towns; six between 500 and 1000 m occupied 2.52%; 16 with 300-500 m occupied 6.72%; eight between 200 and 300 m consisted of 3.36%; 199 were below 200 m, accounting for 83.6%. This indicates that more than 80% of mega-towns are distributed in plain areas, implying that the flatter the terrain, the more likely that mega-towns would flourish.
(2) Location advantage factor. The location of a mega-town refers to the spatial connection between a mega-town and a developed city or core economic body. The closer a mega-town is to a developed city or core economy, the more opportunity it has to accept the radiating effect, which provides advantages to location. This study utilized the distance between a mega-town and its neighbouring core city to roughly characterize the location advantage of the mega-town. The local autocorrelation result of the location advantages shows that mega-towns mainly formed two agglomeration types, namely High-High disadvantage-type and Low-Low advantage-type (Figure 6). The High-High type zone meant a region where all the mega-towns were far from core cities, indicating their location advantages are relatively low. This type was mainly distributed in the central part of China, southern Guangxi and Hainan Province, where there were fewer core cities. The Low-Low type area was mainly situated in the Yangtze River Delta and the Pearl River Delta urban clusters, which was characterized by significant agglomeration. These two urban clusters are the core gathering areas of mega-towns, and they are the two most developed regions in China, where many large cities crowd together, such as Shanghai, Suzhou, Wuxi, etc., in the Yangtze River Delta, Guangzhou and Shenzhen in the Pearl River Delta region. These large cities are economically developed and have strong radiation belts, which have contributed to the development of a large number of mega-towns in the periphery. This implies that the growth of mega-towns is closely related to the advantages of the location.
Figure 6.
Local autocorrelation analysis of location in China in 2015
(3) Economic development factor. Since the reform and opening up of China, there have been significant regional differences in China's socioeconomic development (Sui, 2017). The economic development in the eastern coastal areas such as the Yangtze River Delta and the Pearl River Delta is rapid as compared to other areas. Mega-towns in these regions have become the main choice for industrial transfer and functional evacuation of core cities. The local autocorrelation processing on the economic density distribution is shown in Figure 7. It demonstrates that mega-towns mainly formed three types of concentration zones involving High-High economy-developed type, Low-High type, and Low-Low economy-backward type; these zones were comparatively consistent with the overall spatial agglomeration features of mega-towns. The High-High type was concentrated in the economic core areas of the Yangtze River Delta and the Pearl River Delta, further confirming the positive role of the economic development level on the growth of mega-towns. The Low-High type means that mega-towns surrounding low-economy mega-towns have high economic development levels. This type was mainly distributed around the High-High zones, indicating that the economic radiation effect reduced as the distance from the economic core increased. The Low-Low economic backward type was primarily located in the Northeast Area, Middle Yellow River Area, Middle Yangtze River Area, and Sichuan Basin. The economic development level of these areas was rather weaker than that of the eastern coastal area, and there were fewer megacities or megalopolis with a strong economic driving capacity. For these districts, governors should further strengthen the cultivation of mega-towns to increase cores of regional growth for supporting regional development.
Figure 7.
Local autocorrelation analysis of economic density in China in 2015
(4) Population concentration degree factor. Working as producers and consumers, the population is the primary development body of a town, whose spatial agglomeration could promote the growth and development of the town. Figure 8 signifies that three agglomeration types of zones were formed in space, including the High-High densely-populated type, Low-High type, and Low-Low sparsely-populated type, which were also relatively consistent with the overall spatial concentration characteristics of mega-towns. The High-High densely-populated type was mainly distributed in the densely populated areas of the Yangtze River Delta and the Pearl River Delta, showing the positive role of the population concentration degree on the growth of mega-towns. The Low-High type was mainly concentrated around the High-High zones, which means the closer to the densely populated area, the denser the mega-towns, further confirming the promotion role that the degree of population intensity has on the growth of mega-towns. The Low-Low sparsely-populated type was primarily located in the Northeast Area, Middle Yellow River Area, Middle Yangtze River Area, and Sichuan Basin. The population scale of these areas was much smaller than that of the eastern coastal area, implying a proportional relationship between population factor and mega-towns.
Figure 8.
Local autocorrelation analysis of population density in China in 2015
(5) Traffic condition factor. Road traffic, working as an important transmission medium for urban economic and social relations, plays a vital role in the development of towns (Yang, 2016). For example, the improvement of traffic accessibility is conducive to the expansion of town settlements, as well as the formation of mega-towns. The results of its local autocorrelation showed that (Figure 9), the High-High traffic-developed type zone was mainly formed in the Beijing-Tianjin-Hebei and Yangtze River Delta urban clusters, among which the Yangtze River Delta had a relatively obvious agglomeration feature. Other traffic-developed-type mega-towns existed in the transportation hub cities of Nanchang in Jiangxi, Guangzhou in Guangdong, etc. These areas almost covered all the most developed transportation regions in the country or urban areas. For example, Beijing, as the capital of China, has convenient transportation, from which Beijing-Shanghai, Beijing-Kowloon, Beijing-Guangzhou lines, and other important transportation hubs all start. The High-Low and Low-High types were scattered in the Chengdu-Chongqing urban cluster, Shanxi, Hebei, Anhui, Henan and other provinces. The Low-Low traffic-backward type area was much smaller and mainly distributed in Sichuan Basin, western Hunan, southern Hubei, and coastal areas of Fujian, where road constructions are difficult due to the relatively complex topography and geology of these areas. The government should speed up the building of air transportation to strengthen the spatial connection between mega-towns and developed areas.
Figure 9.
Local autocorrelation analysis of highway density in China in 2015
There are many qualitative factors affecting the growth of mega-towns, including urban institutional mechanisms, management systems, government policies, etc. This research mainly selected national policies for qualitative analysis. The Chinese government has introduced preferential policies for small towns since the reform and opening-up (Wu and Fang, 2009). As the largest developing country in the world with a huge number of small farmers and also rapid urbanization, China considers the development of small towns as an urbanization model. The Chinese “Five-Year Plan”, which has set a goal for national development vision and plan for major construction projects, reflects that the national urban development policy is emphasized on small towns. Benefiting from the support of those favored policies such as land, capital, investment, etc., the economy and population of some towns expanded rapidly and developed into mega-towns.
In addition, the latest standard for setting up towns, made by the Ministry of Civil Affairs in 2000, does not restrict an upper limit on the population size of a town, which means that a town's status would not change regardless of any population size. In light of the division criteria of city size in China, 198 of 238 mega-towns have reached the size standard of type-II small city with a population size of less than 200,000, 38 fit the scale demand of type-I small city whose scale is between 200,000 and 500,000, and another two meet the criterion of medium-sized cities with 500,000-1,000,000 residents. However, the Chinese government does not upgrade them into corresponding cities, because a town is the lowest one in Chinese administrative levels, which cannot fulfill the normal management duties of a city government. Hence, China has formed a unique administrative unit-mega-towns.
5.3 Summary of growth mechanisms of mega-towns
Based on the qualitative and quantitative analysis, this paper found that there are different levels of correlations between all related factors and small towns. The natural resources and environment, especially the topographical conditions, laid the foundation for the growth of mega-towns. The economic factor, population factor, and traffic factor all played positive roles in the development of mega-towns. Among them, the concentration features of the three main agglomeration types of economic density and population density were both relatively consistent with the overall spatial concentration characteristics of mega-towns. In addition, the absolute value of correlation coefficient between population density and mega-towns was the largest according to the results of regression analysis. This reflected that the population concentration degree was the main driving force for the growth and development of the mega-towns. Location advantage's absolute value was the second biggest, signifying that the mega-town was easy to grow around big cities, working as a satellite town or a carrier of the population and industrial transfer. In addition, the national policy orientation and administrative division system played a certain role in the formation of mega-towns.
In fact, there were intricate interactions between the relevant factors, which together scheduled the growth and development of mega-towns. On the one hand, economic development and external traffic conditions have a positive impact on population agglomeration and diffusion (Sun et al., 2009). The faster the economic development, the more developed the transportation, and the more favourable the population agglomeration. On the other hand, the increase of population density would further promote economic development and improve traffic conditions. There was also a mutually reinforcing relationship between economic development, location conditions, and traffic conditions. Natural resource conditions play a background role in economic, populational, and traffic factors. Policy factors play a regulation role in the development of the economy, movement of population, and improvement of transportation facilities to a certain extent. It can be seen that these factors influence each other internally (shown in Figure 10), and work together to affect the growth and development of the mega-towns. Therefore, the growth and development of mega-towns in China were a result of the complex combination role of natural factors and humanistic and social factors.
There were 238 mega-towns in China in 2015. The total population in mega-towns was more than 38 million, occupying 11.82% of the whole small towns although their number only accounted for 1.18%, which reflected their important contributions to urbanization. This paper aims at analysing the spatial distribution features of mega-towns in China, and exploring their growth mechanism to provide certain reference for making town development policies. It adopted the nearest neighbour distance, kernel density estimation, regression analysis, global autocorrelation, local autocorrelation and other spatial analysis methods based on a spatial database of mega-towns in China.
The results showed that the nearest neighbour index r of the existing 238 mega-towns was 0.48, which means that the distribution of mega-towns tended to be a spatial agglomeration pattern. Specifically, they mainly gathered in the southeast coastal areas of China, presenting a pattern of “sparse in the Northwest and dense in the Southeast”. In addition, they formed two spatial core agglomerations and several secondary ones, and a southeast coastal agglomeration belt. They exhibited different spatial agglomeration characteristics in different economic regions and provincial units because of objective natural and human diversities. On the regional scale, mega-towns in each region tended to be a spatial agglomeration distribution, whose nearest neighbour index r was 0.83, 0.71, 0.82, 0.84, 0.70, 0.70, 0.69 and 0.64. As regional development levels decreased and the number of mega-towns dropped, the degree of spatial agglomeration increased relatively. On the provincial level, mega-towns of most provincial-level units in China, occupying 68% of the total provincial units, tended to be a spatial agglomeration distribution, but degrees of agglomeration were generally not high. Only Anhui Province had a random distribution of mega-towns, whose nearest neighbour distance index r was 1. These phenomena showed that the spatial concentration features of mega-towns on the provincial scale were not significant. Besides, the six provinces with uniformly distributed mega-towns had generally fewer mega-towns and four provinces had less than four mega-towns (2, 3, 3, and 4, respectively). On the whole, China's mega-towns exhibited an obvious regional difference in terms of spatial agglomeration characteristics.
With regard to the growth mechanism of mega-towns, this paper mainly adopted quantitative analysis methods, combining with qualitative analysis. It chose topography, location, economy, population and traffic as related factors and selected DEM, location advantage, economic density, population density, and highway density as corresponding indicators of the five quantitative factors. According to regression analysis results, the correlation coefficient R between the number of mega-towns and the five quantitative factors were -0.3911, -0.4899, 0.4617, 0.6893 and 0.0708. In addition, the global autocorrelation results show that they were all spatially agglomerated, whose Moran's I indexes were namely 0.1856, 0.5215, 1.7326, 1.6358 and 0.2233, and Z values were respectively 16.06, 18.60, 61.45, 58.08 and 8.07. Therefore, these factors all showed certain influence on the spatial growth of mega-towns. To further explore the specific impact of factors on the spatial growth of mega-towns and the growth mechanism of mega-towns, this study conducted the local autocorrelation analysis. It found that the natural resource environment played a background role; economic factors, population factors, and traffic factors all produced positive effects. In terms of the location advantage, the closer to big cities or economic bodies, the easier mega-towns were to grow. In addition, it selected national policy as a human factor to make a qualitative analysis on the growth mechanism of mega-towns, and found that the national policy orientation and administrative division system played a regulation role. In fact, there were intricate interactions between all the natural and human factors, which together scheduled the growth and development of mega-towns. Governors should synthetically consider the roles of all the factors while making up mega-town cultivation strategies.
6.2 Discussion
Mega-town works as a key link to realize the interaction between new urbanization and new rural construction, which has a unique role in advancing regional economic growth, absorbing labour employment and other aspects. Provinces and prefecture-level units should make full use of the mega-town functions to promote their socioeconomic development, and adjust the urban development strategies according to the spatial distribution characteristics of mega-towns. China is the largest developing country, which still has the arduous task of urbanization. Fostering mega-towns would benefit the realization of in-situ urbanization, which is conducive to the orderly advancement of the Chinese urbanization process. Particularly, the central and western regions in China, which are dominated by small towns with relatively backward development, need to cultivate mega-towns as new development nodes based on the grasp of their growth mechanism. Meanwhile, the cultivation of mega-towns will help alleviate the population and economic pressures of large cities, to mitigate the problem of “city diseases” to improve the sustainability of large cities. As mega-towns have more responsibility but less power, Zhejiang Province has taken the lead in launching the strategy of “cultivating pilot-towns into small cities”, and achieved remarkable results in terms of systems and mechanisms, development quality and efficiency, ecological environment, etc. In recent years, the state government of China has also adopted this strategy and carried out practical work. This might provide some reference for other developing countries.
References
[1] Small cities? Towards a research agenda. International Journal of Urban and Regional Research, 33, 683-699(2009).
[4] Testing for spatial autocorrelation among regression residuals. Geographical Analysis, 4, 267-284(1972).
[5] The role of small towns in the local economy and some implications for development policy. Local Economy, 15, 280-301(2000).
[6] et alSmall towns as ‘sub-poles’ in English rural development: Investigating rural-urban linkages using sub-regional social accounting matrices. Geoforum, 38, 1219-1232(2007).
[7] The role of small towns in local place making. European Countryside, 427(2016).
[8] The unit of social organization in a large town. The Sociological Review, 7, 23-36(1914).
[9] Exploration on promoting system reform of large towns. China Economic & Trade Herald, 26(2015).
[10] . The Division of Labor in Society(2000).
[11] Visions and actions for medium-size cities: Reports from the European Workshops of Alicante, Volos and Oviedo. European foundation for the improvement of living and working conditions. Luxemburg(1994).
[12] Kleinstädte als Wachstumsmotoren ländlich-peripherer regionen: Das Beispiel Waldviertel. disP-The Planning Review, 48, 63-76(2012).
[13] Promoting the scientific development of urbanization through the reform of the city of mega-towns. Regional Economic Review, 10-11(2017).
[14] Contemporary perspectives of small towns in India: A review. Habitat International, 86, 19-27(2019).
[15] et alPreliminary thoughts on the cultivation of mega-towns as new and medium-sized cities: Taking Zhejiang Province as an example. Urban Studies, 23, 8-13(2016).
[16] Formality versus reality: An exploration of the development process for mega townships in India. The Towers of New Capital: Mega Townships in India, 38-49(2016).
[17] Small Town Sustainability: Economic, Social, and Environmental Innovation. Birkhauser(2009).
[18] Re-urbanity: Urbanising the rural and ruralising the urban. Environment & Planning A, 39, 728-747(2007).
[19] Time and space differentiation of the development of urbanization in China’s urban population. Geographical Research, 38, 85-101(2019).
[20] Linear governance, participatory governance and development governance: A study of social governance in coastal large towns. Journal of the Party School of the Central Committee of the C.T.C, 22, 94-102(2018).
[21] Small-town sustainability: Prospects in the second modernity. European Planning Studies, 18, 1545-1565(2010).
[22] . National Report on the New Urbanization in 2015(2015).
[23] . Beyond the Metropolis: Urban Geography as if Small Cities Mattered(2007).
[24] Analysis of regional economic growth difference and its influencing factors in Anhui Province. National Circulation Economy, 63-65(2018).
[25] Towns (and villages): Definitions and implications in a historical setting. Cliometrica, 269(2017).
[26] Approaches to planning for secondary cities in developing countries. Washington, DC: Rivkin Associates Inc(1982).
[27] Secondary Cities in Developing Countries: Policies for Diffusing Urbanization. Beverly Hills, NJ: Sage(1983).
[28] Alcohol outlets, social disorganization, land use, and violence in a large college town: Direct and moderating effects. Criminal Justice Review, 38, 29-49(2013).
[29] The role and development perspectives of small towns in Central Serbia. Spatium, 8-15(2006).
[31] Research and realization about spatial analysis in the SVG-based WebGIS. Journal of Chinese Computer Systems, 33, 1770-1773(2012).
[32] Concentration and decentralization of population in the Beijing-Tianjin-Hebei metropolitan region and its determinants: A regional density function approach. Acta Geographica Sinica, 64, 956-966(2009).
[33] World Urbanization Prospects: The 2018 Revision. New York: United Nations(2018).
[34] Small towns of hope and glory InL Vaz T N, van Leeuwen E, Nijkamp P (eds.). Towns in Rural World. Farnham: Ashgate, 3-10(2013).
[35] Research on the transformation and upgrading of administrative divisions of big towns. Intelligence, 226(2018).
[36] The development of small towns in the process of urbanization: Taking large towns as an example. China Economic & Trade Herald, 60-61(2014).
[37] The development history and new situation of small towns in the past 60 years in New China. Economic Geography, 29, 1605-1611(2009).
[38] Reform of administrative division system in mega-towns in economically developed areas. Planners, 32, 34-39(2016).
[40] Introduction: Reclaiming small towns. In: Denis E, Zerah M-H (eds.). Subaltern Urbanisation in India: An Introduction to the Dynamics of Ordinary Towns. New Delhi: Springer(2017).
Xueqin WANG, Shenghe LIU, Wei QI. Mega-towns in China: Their spatial distribution features and growth mechanisms[J]. Journal of Geographical Sciences, 2020, 30(7): 1060