• Photonics Research
  • Vol. 10, Issue 2, 491 (2022)
Mengqi Shen1、†, Qi Zou1、†, Xiaoping Jiang1、2, Fu Feng1, and Michael G. Somekh1、3、*
Author Affiliations
  • 1Nanophotonics Research Center, Shenzhen Key Laboratory of Micro-Scale Optical Information Technology & Institute of Microscale Optoelectronics, Shenzhen University, Shenzhen 518060, China
  • 2Department of Electronics and Information Engineering, The Hong Kong Polytechnic University, Hung Hom, Hong Kong, China
  • 3Faculty of Engineering, University of Nottingham, Nottingham NG7 2RD, UK
  • show less
    DOI: 10.1364/PRJ.445189 Cite this Article Set citation alerts
    Mengqi Shen, Qi Zou, Xiaoping Jiang, Fu Feng, Michael G. Somekh. Single-shot three-input phase retrieval for quantitative back focal plane measurement[J]. Photonics Research, 2022, 10(2): 491 Copy Citation Text show less
    Schematic of the system used to recover the complex field of the BFP, showing three cameras are placed at three corresponding detection arms with various negative defocus positions. One additional arm (the yellow dashed circle plane) was inserted for direct observation of the intensity in the back focal plane. This was not used in any of the reconstructions and simply used for comparison.
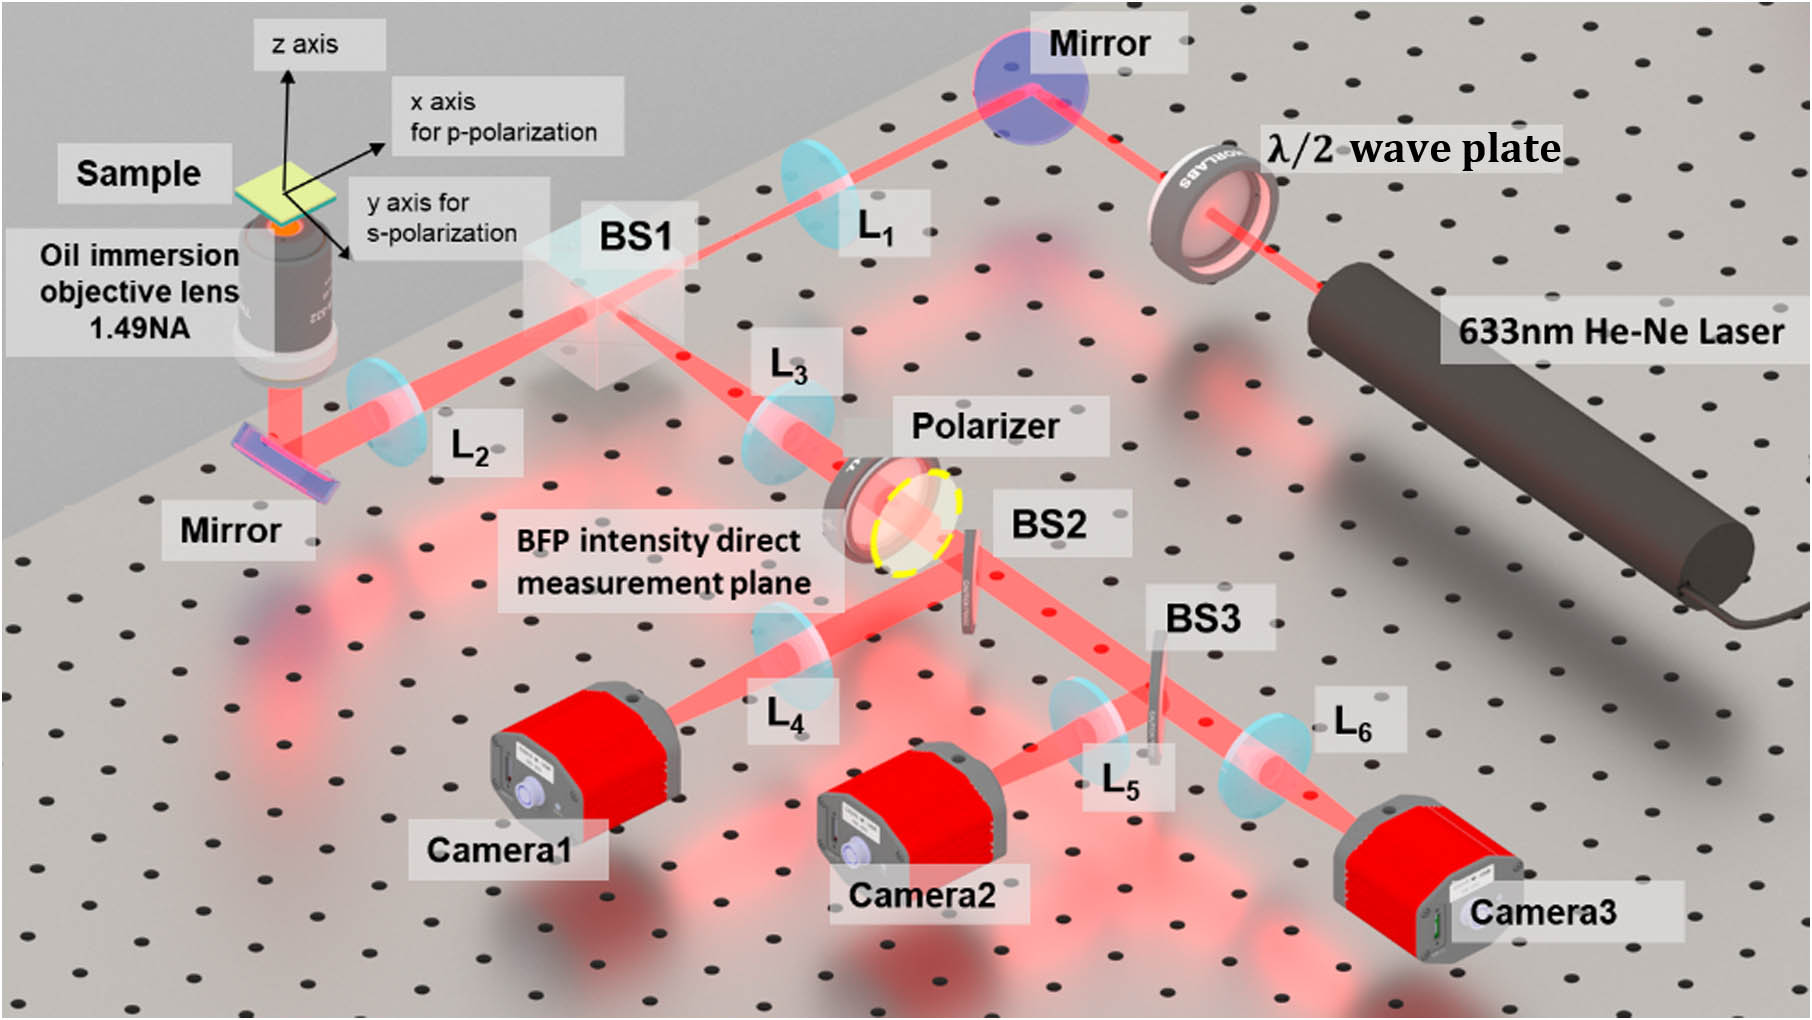
    Fig. 1. Schematic of the system used to recover the complex field of the BFP, showing three cameras are placed at three corresponding detection arms with various negative defocus positions. One additional arm (the yellow dashed circle plane) was inserted for direct observation of the intensity in the back focal plane. This was not used in any of the reconstructions and simply used for comparison.
    (a) Measured amplitude comparison between various thicknesses of the gold layer along p polarization; (b) retrieved phase transition comparison between different thicknesses of the gold layer along p polarization. The thick layers show the characteristic phase inversion.
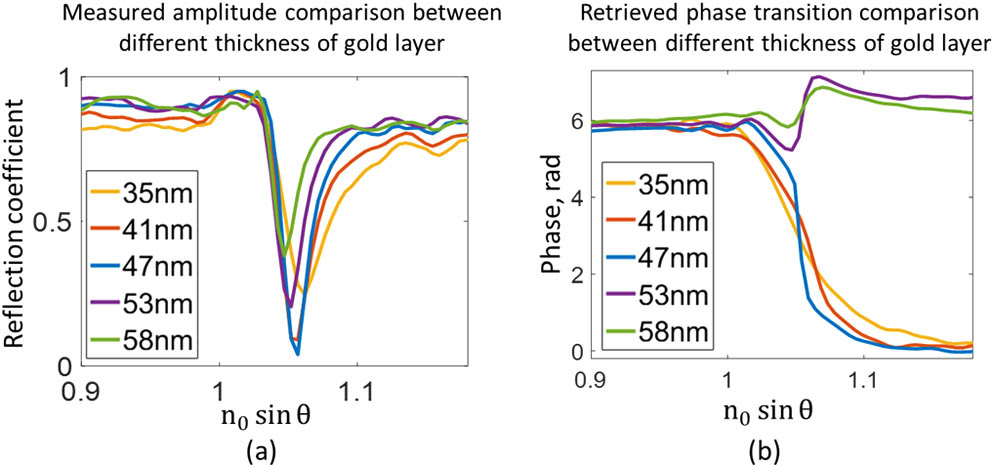
    Fig. 2. (a) Measured amplitude comparison between various thicknesses of the gold layer along p polarization; (b) retrieved phase transition comparison between different thicknesses of the gold layer along p polarization. The thick layers show the characteristic phase inversion.
    (a) Measured amplitude comparison between various thicknesses of the silver layer along p polarization; (b) recovered phase transition comparison between different thicknesses of the silver layer along p polarization.
    Fig. 3. (a) Measured amplitude comparison between various thicknesses of the silver layer along p polarization; (b) recovered phase transition comparison between different thicknesses of the silver layer along p polarization.
    Reradiated leakage propagating light from the surface plasmon.
    Fig. 4. Reradiated leakage propagating light from the surface plasmon.
    (a) Retrieved BFP amplitude distribution for 41 nm thick gold sample; (b) retrieved BFP phase distribution for 41 nm thick gold sample; (c) blue line is the amplitude line trace of p polarization after noise reduction, and black dashed line is the pupil function applied; (d) blue line is the phase line trace of p polarization after noise reduction, and black dashed line is the pupil function applied.
    Fig. 5. (a) Retrieved BFP amplitude distribution for 41 nm thick gold sample; (b) retrieved BFP phase distribution for 41 nm thick gold sample; (c) blue line is the amplitude line trace of p polarization after noise reduction, and black dashed line is the pupil function applied; (d) blue line is the phase line trace of p polarization after noise reduction, and black dashed line is the pupil function applied.
    (a) Normalized experimental V(z) attenuation measurements for 35 nm (yellow curve), 41 nm (red curve), 47 nm (blue curve), 53 nm (purple curve), 58 nm (green curve) thick gold samples; (b) natural log scale of the V(z) curves in (a); (c) normalized experimental V(z) attenuation measurements for 40 nm (yellow curve), 47 nm (red curve), 53 nm (blue curve), 60 nm (purple curve), 66 nm (green curve) thick silver samples; (d) natural log scale of the V(z) curves in (c).
    Fig. 6. (a) Normalized experimental V(z) attenuation measurements for 35 nm (yellow curve), 41 nm (red curve), 47 nm (blue curve), 53 nm (purple curve), 58 nm (green curve) thick gold samples; (b) natural log scale of the V(z) curves in (a); (c) normalized experimental V(z) attenuation measurements for 40 nm (yellow curve), 47 nm (red curve), 53 nm (blue curve), 60 nm (purple curve), 66 nm (green curve) thick silver samples; (d) natural log scale of the V(z) curves in (c).
    (a) Attenuation coefficients due to coupling loss and ohmic loss with varying gold thickness; (b) attenuation coefficients due to coupling loss and ohmic loss with varying silver thickness, obtained computationally as opposed to manipulation of the spatial light modulator.
    Fig. 7. (a) Attenuation coefficients due to coupling loss and ohmic loss with varying gold thickness; (b) attenuation coefficients due to coupling loss and ohmic loss with varying silver thickness, obtained computationally as opposed to manipulation of the spatial light modulator.
    (a) Dip positions calculated by amplitude; (b) dip positions calculated by V(z); (c) dip positions calculated by combining V(z) and amplitude.
    Fig. 8. (a) Dip positions calculated by amplitude; (b) dip positions calculated by V(z); (c) dip positions calculated by combining V(z) and amplitude.
    Flow chart of three-input phase retrieval algorithm.
    Fig. 9. Flow chart of three-input phase retrieval algorithm.
    (a) Normalized intensity comparison between three raw images and the HDR image; (b) shows the coefficients and stitching positions to produce the HDR image; (c) raw image 1 in log10 scale, this is a long exposure image that shows the low intensity values but saturates the center values; (d) raw image 2 in log10 scale; (e) raw image 3 in log10 scale, this is a short exposure image that shows the high intensity center but loses the low intensity regions away from the center; (f) the final HDR image.
    Fig. 10. (a) Normalized intensity comparison between three raw images and the HDR image; (b) shows the coefficients and stitching positions to produce the HDR image; (c) raw image 1 in log10 scale, this is a long exposure image that shows the low intensity values but saturates the center values; (d) raw image 2 in log10 scale; (e) raw image 3 in log10 scale, this is a short exposure image that shows the high intensity center but loses the low intensity regions away from the center; (f) the final HDR image.
    Schematic of BFP for linear polarization.
    Fig. 11. Schematic of BFP for linear polarization.
    (a) Simulated back focal plane with high-frequency noise case; (b) back focal plane with mid-frequency noise case; (c) back focal plane with low-frequency noise case.
    Fig. 12. (a) Simulated back focal plane with high-frequency noise case; (b) back focal plane with mid-frequency noise case; (c) back focal plane with low-frequency noise case.
    Table 1. Retrieved Phase, Retrieved Amplitude, and Measured Amplitude of BFPs for Five Different Thicknesses of Gold Layers
    Table 2. Retrieved Phase, Retrieved Amplitude, and Measured Amplitude of BFPs for Five Different Thicknesses of Silver Layers
    Mengqi Shen, Qi Zou, Xiaoping Jiang, Fu Feng, Michael G. Somekh. Single-shot three-input phase retrieval for quantitative back focal plane measurement[J]. Photonics Research, 2022, 10(2): 491
    Download Citation