• Laser & Optoelectronics Progress
  • Vol. 60, Issue 1, 0114004 (2023)
Jie Yin1、2, Houming Zhou1、*, Zhenyu Zhao2、**, Hao Zhou1、2, Kai Li1、2, and Chao Wang1、2
Author Affiliations
  • 1School of Mechanical Engineering, Xiangtan University, Xiangtan 411105, Hunan, China
  • 2School of Intelligent Manufacturing and Equipment, Shenzhen Institute of Information Technology, Shenzhen 518172, Guangdong, China
  • show less
    DOI: 10.3788/LOP212714 Cite this Article Set citation alerts
    Jie Yin, Houming Zhou, Zhenyu Zhao, Hao Zhou, Kai Li, Chao Wang. Experimental Research on Laser Polishing of DC53 Hardened Steel[J]. Laser & Optoelectronics Progress, 2023, 60(1): 0114004 Copy Citation Text show less
    Laser polishing test. (a) Device diagram; (b) principle diagram
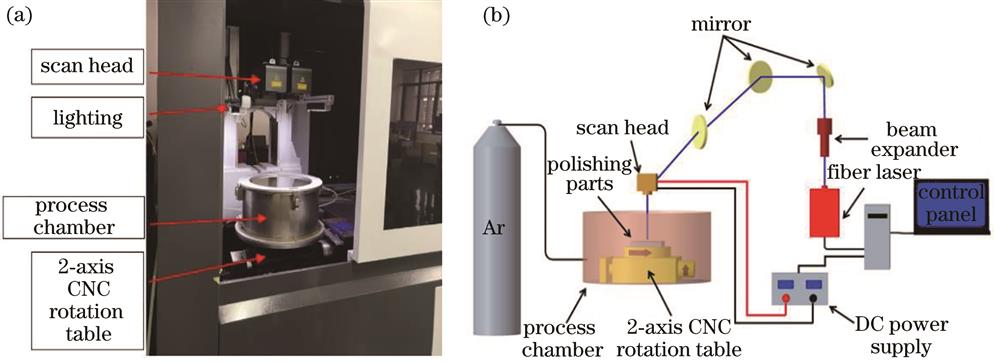
    Fig. 1. Laser polishing test. (a) Device diagram; (b) principle diagram
    Effect of scanning speed on surface roughness under different powers
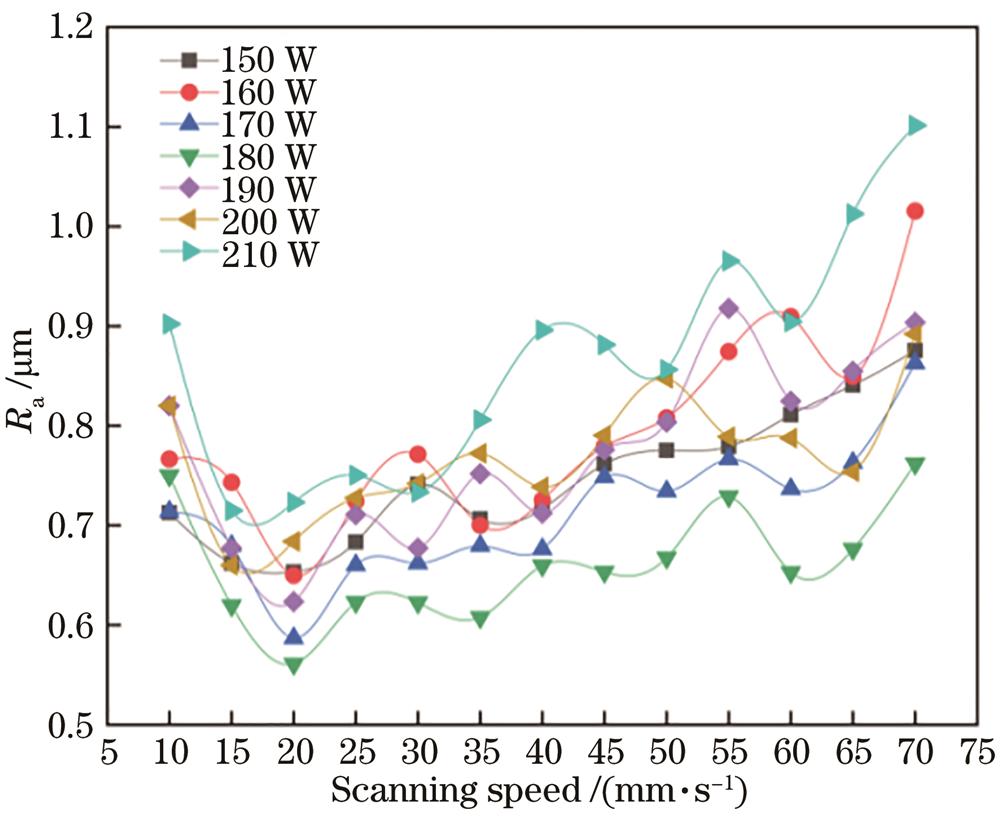
    Fig. 2. Effect of scanning speed on surface roughness under different powers
    Scatter plot. (a) Energy density and surface roughness; (b) energy density and surface roughness reduction rate
    Fig. 3. Scatter plot. (a) Energy density and surface roughness; (b) energy density and surface roughness reduction rate
    Mechanism of laser polishing. (a) Incomplete melting; (b) shallow surface melting; (c) surface over melting
    Fig. 4. Mechanism of laser polishing. (a) Incomplete melting; (b) shallow surface melting; (c) surface over melting
    Comparison of surface topography before and after laser polishing. (a) Before laser polishing; (b) after laser polishing
    Fig. 5. Comparison of surface topography before and after laser polishing. (a) Before laser polishing; (b) after laser polishing
    Effect of different scanning spacings on surface roughness
    Fig. 6. Effect of different scanning spacings on surface roughness
    Surface morphology of sample 2 after laser polishing
    Fig. 7. Surface morphology of sample 2 after laser polishing
    Comparative analysis of laser polishing results. (a) Surface profiles before and after polishing; (b) power spectral density analysis results
    Fig. 8. Comparative analysis of laser polishing results. (a) Surface profiles before and after polishing; (b) power spectral density analysis results
    Internal structure and properties of the material after polishing. (a) Microstructure; (b) hardness; (c) internal Young's modulus
    Fig. 9. Internal structure and properties of the material after polishing. (a) Microstructure; (b) hardness; (c) internal Young's modulus
    Microstructure of each region of DC53 material under 1000× scanning electron microscope. (a) Melting zone; (b) heat affected zone; (c) annealing zone; (d) matrix zone
    Fig. 10. Microstructure of each region of DC53 material under 1000× scanning electron microscope. (a) Melting zone; (b) heat affected zone; (c) annealing zone; (d) matrix zone
    Tafel curves before and after polishing
    Fig. 11. Tafel curves before and after polishing
    XRD diagram before and after laser polishing
    Fig. 12. XRD diagram before and after laser polishing
    ElementCMnMoSiCrV
    Mass fraction /%0.95-1.050.30-0.352.000.90-0.957.55-8.500.25-0.30
    Table 1. Chemical composition of DC53 die steel
    Experimental parameterValue
    Laser power /W150-210
    Scanning speed /(mm·s-110-70
    Defocus /mm0
    Spot size /μm300
    Scan interval /μm50
    Protective gasAr
    Table 2. Experimental parameters
    SampleE /mVIcorr /(10-6 A·m-2Corrosion rate /mpy
    Initial sample-710.48410.6470.67305
    Laser polished-739.049131.3148.30040
    Table 3. Self-corrosion potential, self-corrosion current density, and corrosion rate of DC53 before and after polishing
    Jie Yin, Houming Zhou, Zhenyu Zhao, Hao Zhou, Kai Li, Chao Wang. Experimental Research on Laser Polishing of DC53 Hardened Steel[J]. Laser & Optoelectronics Progress, 2023, 60(1): 0114004
    Download Citation