
Shuai Qiao, Rui Wang, Xiaocheng Hou. Electrical Crosstalk of Photovoltaic HgCdTe Array Detector[J]. Acta Optica Sinica, 2023, 43(4): 0404002
- Acta Optica Sinica
- Vol. 43, Issue 4, 0404002 (2023)
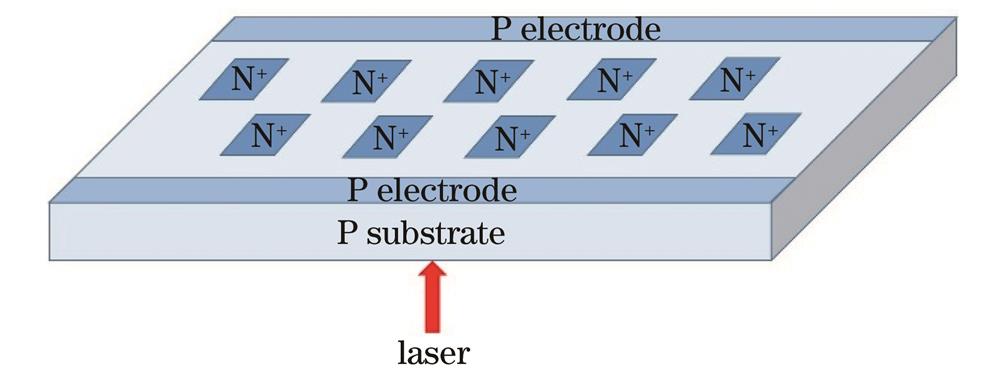
Fig. 1. Schematic diagram of photosensitive element array
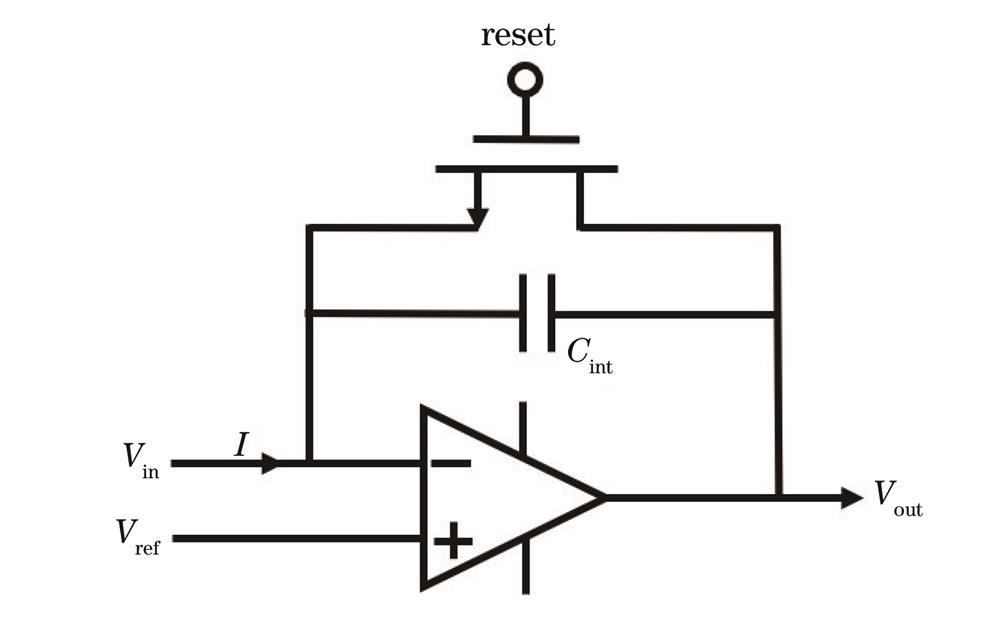
Fig. 2. Structural diagram of CTIA
Fig. 3. Schematic diagram of experimental optical path
Fig. 4. Response of irradiated and unirradiated pixels under laser irradiation with different energies
Fig. 5. Schematic diagram of detector irradiated by laser
Fig. 6. Schematic diagram of readout circuit in model
Fig. 7. Electron concentration distribution varying with laser incident time t. (a) t=0; (b) t=15 ps; (c) t=30 ps; (d) t=200 ps; (e) t=1000 ps; (f) t =2000 ps
Fig. 8. Electron concentration in center of each pixel varying with time at different laser energies. (a) 1.5 mJ/cm2; (b) 15 mJ/cm2; (c) 150 mJ/cm2; (d) 600 mJ/cm2
Fig. 9. Electron concentration and electric field direction of plane α
Fig. 10. Voltage of common P electrode varying with time
Fig. 11. Electron concentration distribution in trench isolation model
Fig. 12. Crosstalk rate varying with trench length

Set citation alerts for the article
Please enter your email address
© Copyright 2018-2021 | Chinese Laser Press. All Rights Reserved 沪ICP备15018463号-20