• Journal of Geographical Sciences
  • Vol. 30, Issue 5, 724 (2020)
Liang ZHOU1、2, Chenghu ZHOU2, Lei CHE3、*, and Bao WANG4
Author Affiliations
  • 1Faculty of Geomatics, Lanzhou Jiaotong University, Lanzhou 730070, China
  • 2State Key Laboratory of Resources and Environmental Information System, Institute of Geographic Sciences and Natural Resources Research, CAS, Beijing 100101, China
  • 3School of Architecture and Urban Planning, Nanjing University, Nanjing 210093, China
  • 4Northwest Institute of Eco-Environment and Resources, CAS, Lanzhou 730000, China
  • show less
    DOI: 10.1007/s11442-020-1752-5 Cite this Article
    Liang ZHOU, Chenghu ZHOU, Lei CHE, Bao WANG. Spatio-temporal evolution and influencing factors of urban green development efficiency in China[J]. Journal of Geographical Sciences, 2020, 30(5): 724 Copy Citation Text show less
    The temporal evolution of UGDE in China from 2005 to 2015
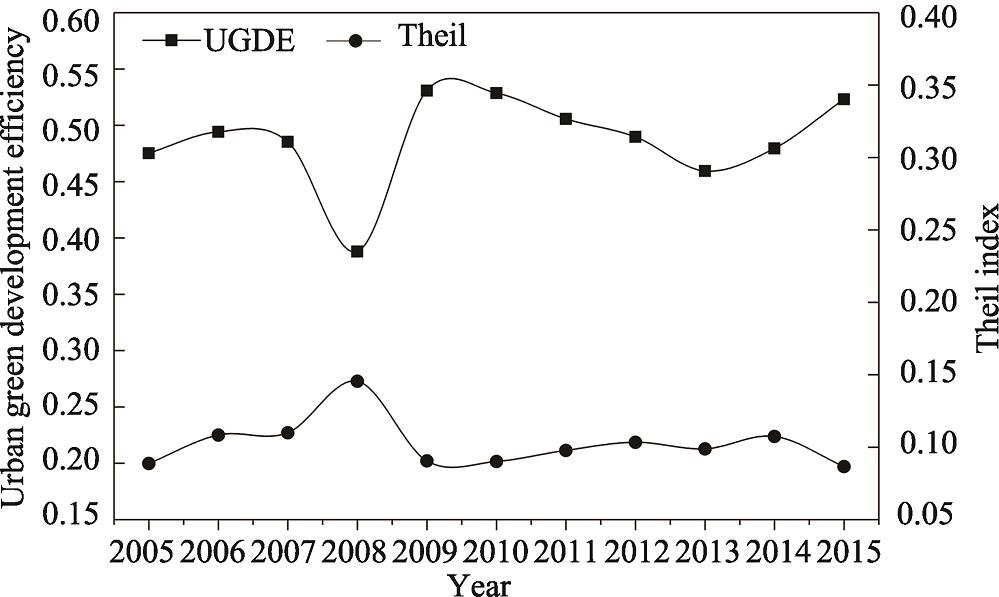
    Fig. 1. The temporal evolution of UGDE in China from 2005 to 2015
    The decomposition of the Theil index of UGDE in different regions of China
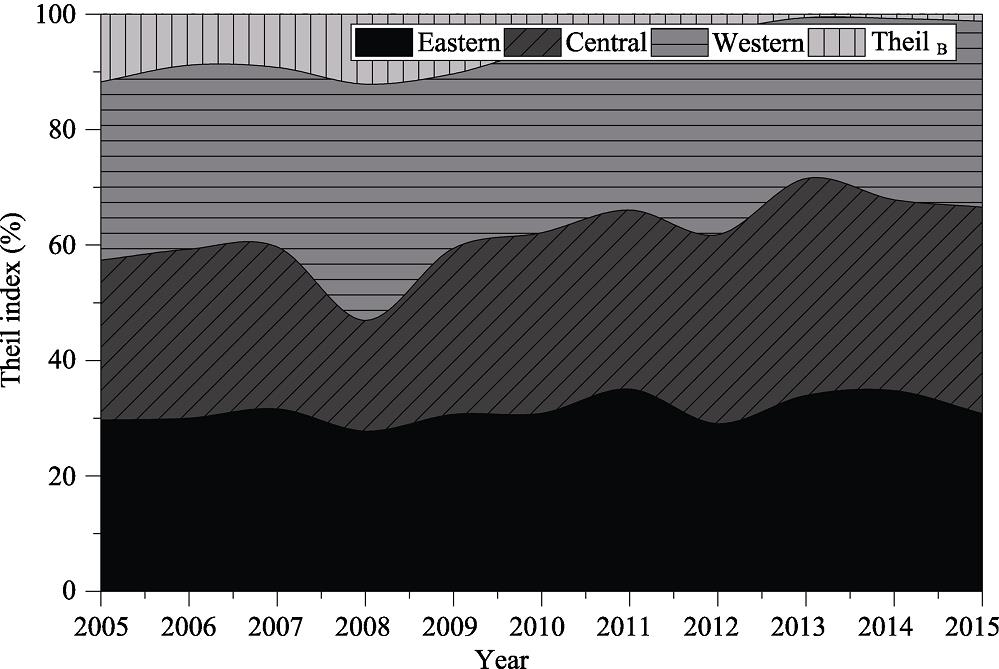
    Fig. 2. The decomposition of the Theil index of UGDE in different regions of China
    The multi-level evolution of UGDE in urban agglomerations of China from 2005 to 2015
    Fig. 3. The multi-level evolution of UGDE in urban agglomerations of China from 2005 to 2015
    The UGDE in multi-level urban agglomerations from 2005 to 2015
    Fig. 4. The UGDE in multi-level urban agglomerations from 2005 to 2015
    The factors influencing the mechanism of UGDE in China
    Fig. 5. The factors influencing the mechanism of UGDE in China
    TypeFirst level indicatorsSecond level indicatorsThird level indicators
    InputCapitalFixed capital stockTotal social fixed capital investment
    LaborNumber of unit employersNumber of unit employees at the end of the year
    TechnologyNumber of patent authorizationsNumber of patent applications granted by region
    ResourcesWater, land, and energy consumptionTotal water supply, urban built-up area, total electricity consumption
    Artificial and natural gas supply, liquefied gas supply
    OutputDesirable outputEconomic benefitsGDP (constant price in 2005)
    Social benefitsAverage wage of urban employees, total retail sales of consumer goods
    Environmental benefitsArea of urban green space, percentage cover of green space, utilization rate of industrial solid waste
    centralized treatment rate of sewage treatment plants, treatment rate of harmless domestic garbage
    Undesirable outputEnvironmental pollutionAmount of industrial wastewater, amount of industrial SO2 emitted, amount of industrial dust emitted
    Table 1.

    The evaluation of UGDE in China

    Type2005-20082008-20092009-2015
    123412341234
    110.8470.0970.0280.0280.7620.1190.0710.0480.8440.1310.0100.015
    20.2920.4770.2000.0310.1900.2380.4760.0950.2020.5510.1910.056
    30.1670.2500.4170.1670.1670.4170.2500.1670.0000.2750.6250.100
    40.1110.1110.2220.5560.2220.0000.0000.7780.0340.0520.1900.724
    210.6740.3040.0220.0000.3570.5000.0710.0710.8050.1610.0110.023
    20.2500.5150.1760.0590.1540.3460.3850.1150.1670.5920.2250.017
    30.1180.1960.5490.1370.0450.0910.5000.3640.0160.2030.6260.154
    40.0000.0430.0870.8700.0000.0000.2220.7780.0100.0510.1530.786
    310.7400.2600.0000.0000.4550.3640.0910.0910.6920.2820.0130.013
    20.2800.4800.2000.0400.1760.2940.4710.0590.1300.6520.1740.043
    30.0820.2190.5480.1510.0770.2310.3080.3850.0170.1820.6450.157
    40.0190.0740.1480.7590.0000.1000.2000.7000.0090.0260.1830.783
    410.8330.1330.0330.0000.6000.4000.0000.0000.8380.1620.0000.000
    20.2070.5170.2410.0340.0560.3890.5560.0000.1200.6520.1630.065
    30.0490.2460.5570.1480.0000.1110.5000.3890.0100.2860.4800.224
    40.0000.0100.2370.7530.0000.0420.0420.9170.0000.0310.2210.748
    Table 2.

    The spatial Markov transfer matrix of UGDE from 2005 to 2015

    VariableModel (1)Z valueModel (2)Z valueModel (3)Z value
    Human and social factorsrgdp0.025***3.680.030***4.20
    rgdp20.013***3.680.015***4.20
    is0.087*1.550.089*1.58
    fdi0.007**2.070.005*1.50
    te-0.439***-6.64-0.453***-6.84
    Natural background factorstem0.005**2.320.007***3.21
    pre-0.004-0.67-0.001-0.40
    eq0.00010.280.00040.38
    ndvi0.119*1.67-0.0271.01
    C0.212***-3.710.723***-3.620.099***1.01
    Correlation testsigma_u0.1810.1870.178
    sigma_e0.1390.1410.139
    rho0.6280.6380.621
    likelihood ratio test1305.721262.741312.67
    Table 3.

    The estimation of the factors influencing UGDE in China

    Liang ZHOU, Chenghu ZHOU, Lei CHE, Bao WANG. Spatio-temporal evolution and influencing factors of urban green development efficiency in China[J]. Journal of Geographical Sciences, 2020, 30(5): 724
    Download Citation