
Liang ZHOU, Chenghu ZHOU, Lei CHE, Bao WANG. Spatio-temporal evolution and influencing factors of urban green development efficiency in China[J]. Journal of Geographical Sciences, 2020, 30(5): 724
- Journal of Geographical Sciences
- Vol. 30, Issue 5, 724 (2020)
Abstract
Keywords
1 Introduction
The construction of an ecological civilization is a fundamental strategy for sustainable development in China, and the development of a high-quality modern economic system and solving pollution problems are key features of this policy. China’s development has undergone an evolution through “disordered development”, “black development”, “circular development”, and “sustainable development”, and is gradually transiting toward green development (GD). As an important part of the construction of an ecological civilization, GD can resolve the conflicts between development and the preservation of the natural environment, solve ecological problems, and satisfy the demands of citizens for beautiful environments, such as fresh water, green mountains, and a high quality ecological environment (
Green development, as an important way to achieve sustainable economic, social, and environmental development, is gradually becoming the focus of the global sustainable development goals (SDGs) and human development (
The concept of GD is closely related to the traditional Chinese concept of harmony between man and nature, as well as the modern concept of sustainable development. It also concurs with the mantra of “lucid waters and lush mountains are invaluable assets” and the construction of an ecological civilization in the modern era. Chinese researchers have extensively studied the implementation of GD strategies and policies, as well as the related driving and restricting factors. Through an analysis of the concept and implications, mode of transformation, strategic countermeasures and driving (restricting) factors, measurement and evaluation indexes, theory, and application of GD, a relatively systematic theoretical system has been formed (
A city is a complex open giant system, with multiple elements. Studying urban green development efficiency (UGDE) will enable the identification of the development status of “economic-social-natural” factors and enable the effective allocation of the resources used in urban development (
2 Data and methods
2.1 Data sources
There were three main data sources used in the study. (1) Natural and environmental data. The annual average temperature and annual precipitation data were obtained from the China Meteorological Data Service Center (http://data.cma.cn/site). The original data were in the form of monthly data from 756 meteorological stations across the country. After excluding abnormal station values, the annual average of the remaining 703 stations was calculated. Then, the Kriging interpolation method was used to generate the raster data of the time series of annual average temperature and annual precipitation in China from 2005 to 2015. We used the 2004-2016 global atmospheric PM2.5 concentration raster data published by NASA as the basic research data (http://earthdata.nasa.gov), which had a resolution of 0.01°. Where data was unavailable, we took the mean value of the three years before and after as the PM2.5 concentration in the missing year (
2.2 Methods
2.2.1 SBM-Undesirable model
In addition to desirable outputs in the process of urban development, undesirable outputs such as environmental pollution will also be produced. Traditional radial models fail to take into account the invalid decisions making unit (DMU) slack variables, so there is a bias in the efficiency measurements for the presence of undesirable outputs. To correct the slack variable,
where
2.2.2 Regional differences measurement
The Theil Index was used to measure the degree of regional differences in UGDE (
where
2.2.3 Spatial Markov chain
A spatial Markov chain was constructed by combining the methods of Markov with spatial lag, which can effectively analyze the spatial interactions in the change process of UGDE (
where
2.3 Construction of an assessment system
An input-output index system of Chinese UGDE was established based on the input-output model (
| Type | First level | Second level indicators | Third level indicators |
|---|---|---|---|
| Input | Capital | Fixed capital stock | Total social fixed capital investment |
| Labor | Number of unit employers | Number of unit employees at the end of the year | |
| Technology | Number of patent authorizations | Number of patent applications granted by region | |
| Resources | Water, land, and energy | Total water supply, urban built-up area, total electricity | |
| Artificial and natural gas supply, liquefied gas supply | |||
| Output | Desirable output | Economic benefits | GDP (constant price in 2005) |
| Social benefits | Average wage of urban employees, total retail sales | ||
| Environmental benefits | Area of urban green space, percentage cover of green space, utilization rate of industrial solid waste | ||
| centralized treatment rate of sewage treatment plants, | |||
| Undesirable output | Environmental pollution | Amount of industrial wastewater, amount of industrial |
Table 1.
The evaluation of UGDE in China
3 Spatio-temporal differentiation of UGDE in China
3.1 Temporal evolution of UGDE in China
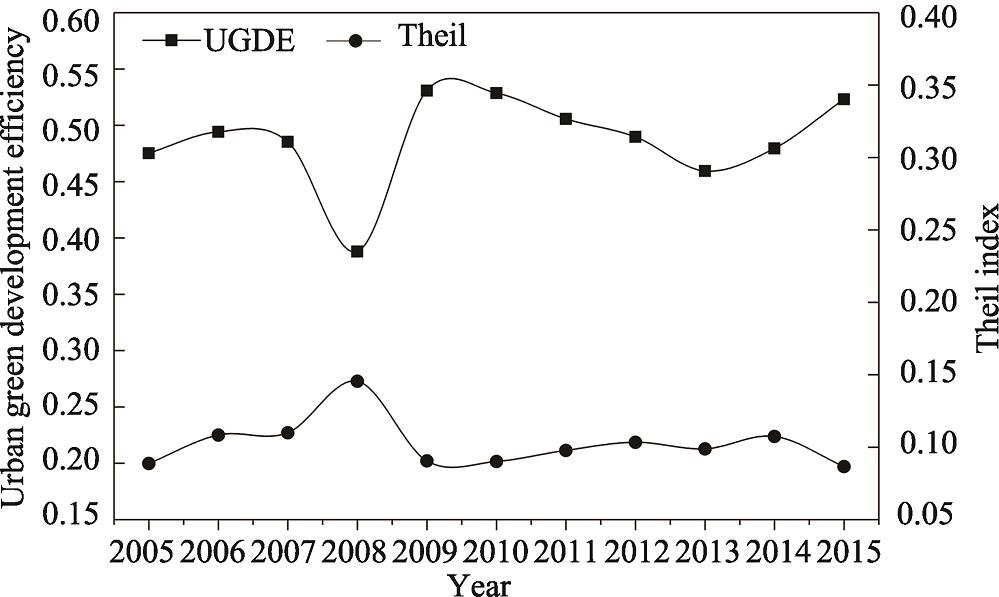
Based on the SBM-Undesirable model, the UGDE and its regional difference index (i.e., the Theil index) of 285 prefecture-level cities in China from 2005 to 2015 were measured respectively (
![]()
Figure 1.The temporal evolution of UGDE in China from 2005 to 2015
There were three stages of UGDE development. In the first phase (2005-2008), UGDE fluctuated and declined from 0.475 in 2005 to 0.388 in 2008, a decrease of 24%. There was a rapid expansion in the regional differences from 0.089 in 2005 to 0.145 in 2008, an increase of 64%. In the second phase (2008-2009), UGDE rapidly improved from 0.388 in 2008 to 0.531 in 2009, a change of 37%. During this period, regional differences were well controlled and the Theil index fell from 0.145 in 2008 to 0.091 in 2009, a 61% decrease. The low-carbon and green sustainable development path in the post-financial crisis era has led to an increase in UGDE and the reduction of regional differences. In the third phase (2009-2015), the UGDE presented a “V-shaped” change, while the regional difference presented an inverted “V” saddle shape. In the “12th Five-Year Plan” (2011-2015), the Chinese government has given increasing attention to structural adjustment, energy reduction, and coordinated regional development. As a result, UGDE gradually increased after a period of decline caused by the initial adjustment, and the degree of regional difference has gradually eased.
3.2 Spatial differentiation of UGDE in China
To explore the spatio-temporal characteristics of UGDE from multiple perspectives in different regions, at different levels of urban agglomeration, and in cities of different scales, China was divided into three regions, 20 urban agglomerations, and five urban levels. This enabled a systematic analysis according to the patterns of economic and geographic development and regional spatial characteristics. The three major regional blocks were the eastern, central, and western regions. Twenty urban agglomerations were divided into national, regional, and local urban agglomerations based on the national “5+9+6” urban agglomeration planning and construction goals (
3.2.1 The phenomenon of three major regional differences
From 2005 to 2015, the UGDE in the eastern, central, and western regions all displayed a “W-shaped” pattern, with average values of 0.548, 0.475, and 0.428, respectively. The UGDE followed an “eastern > central > western” stepwise decreasing pattern (
![]()
Figure 2.The decomposition of the Theil index of UGDE in different regions of China
The eastern region was dependent on its own resources for development and had a strong ability to effectively manage resources and the environment. During the reform and opening up period, technological innovation and information technology became prominent, and the pressure on resources and the environment gradually decreased. Over time, UGDE maintained a steady medium and high paced growth rate, with the eastern region ultimately having the highest UGDE growth rate of the three regions. With the adjustment and transformation of industry and urbanization, resource depletion gradually became an issue in the development of some industrial cities in the central region. The central region was characterized by early and large scale resource development and many cities became industrially depleted. Structural problems in economic development persisted for a long time, with the weakening of institutions and mechanisms. The lack of innovation and entrepreneurship led to increased difficulties in achieving sustainable development. Because urban development in the western region was dominated by an inward-oriented economy and was greatly influenced by policy, it was not only subject to the constraints imposed by path dependence in the development process but also consumed large amounts of resources. Coupled with the single regional economic model and imperfect market mechanisms, the UGDE was always lower than in the eastern and central regions.
3.2.2 Factors controlling the development of multi-level urban agglomerations
From 2005 to 2015, the UGDE of different urban agglomerations increased, which was also in line with the characteristics of the overall UGDE. The UGDE of each urban agglomeration presented the characteristics of an inverted-pyramid cluster growth, which was specifically represented by the pattern of national-level urban agglomerations > regional urban agglomerations > local urban agglomerations (
![]()
Figure 3.The multi-level evolution of UGDE in urban agglomerations of China from 2005 to 2015
National-level urban agglomerations, as the key development areas of the country, had a high level of resource allocation, but under the constraints of natural resources, social development, and economic growth, the UGDE in national-level urban agglomerations did not significantly improve from its high starting point. In contrast, in regional urban agglomerations and local urban agglomerations, which were composed of non-core cities and regional cities, there was a steady improvement in UGDE as the cities developed. The higher the level of urban agglomeration, the closer the internal cities were in terms of their UGDE, and the better the degree of urban development, the higher the level of UGDE.
Regional urban agglomerations were found to be well placed to meet the state’s need to formulate policies for the construction of an ecological civilization and promotion of GD. For example, the Chengdu-Chongqing urban agglomeration initiated a “two-wheel drive” to promote the rapid development of UGDE, with a strategy of western development and the establishment of a “National Demonstration Area for National Urban and Rural Coordinated Reform.” In the middle reaches of the Yangtze River, urban agglomerations have made full use of the strategic opportunities of the rise of the central area of the country, and the development opportunities of the “two-type social reform pilot zone (i.e., a pilot area for the national resource-saving and environment-friendly mechanism)” in Wuhan metropolitan area. As a result, the Changsha-Zhuzhou-Xiangtan urban agglomeration has made great developmental progress. The Yangtze River Delta, Pearl River Delta, and the Beijing-Tianjin-Hebei urban agglomerations have maintained their leading positions in GD due to their advantages in technological progress, industrial infrastructure upgrades, resource utilization, and environmental protection.
3.2.3 Characteristics of the hierarchical structure among cities of different sizes
There was a positive correlation between the UGDE and population, with hierarchical scale characteristics of “super cities > mega cities > large cities > medium cities > small cities” (
![]()
Figure 4.The UGDE in multi-level urban agglomerations from 2005 to 2015
3.3 Spatio-temporal dynamic characteristics of UGDE in China
The traditional Markov transition matrix indicates a change between sample types, but it lacks a spatial perspective and cannot explain the characteristics of spatio-temporal dynamic transfers in the context of different regional interactions. Therefore, a spatial Markov transfer matrix was used to reveal the spatio-temporal dynamic characteristics of UGDE. According to the distribution characteristics of UGDE, it can be divided into four types: low-efficiency, medium-efficiency, relatively high-efficiency, and high-efficiency. The research period was divided into three stages: 2005-2008, 2008-2009, and 2008-2015 (
| Type | 2005-2008 | 2008-2009 | 2009-2015 | ||||||||||
|---|---|---|---|---|---|---|---|---|---|---|---|---|---|
| 1 | 2 | 3 | 4 | 1 | 2 | 3 | 4 | 1 | 2 | 3 | 4 | ||
| 1 | 1 | 0.847 | 0.097 | 0.028 | 0.028 | 0.762 | 0.119 | 0.071 | 0.048 | 0.844 | 0.131 | 0.010 | 0.015 |
| 2 | 0.292 | 0.477 | 0.200 | 0.031 | 0.190 | 0.238 | 0.476 | 0.095 | 0.202 | 0.551 | 0.191 | 0.056 | |
| 3 | 0.167 | 0.250 | 0.417 | 0.167 | 0.167 | 0.417 | 0.250 | 0.167 | 0.000 | 0.275 | 0.625 | 0.100 | |
| 4 | 0.111 | 0.111 | 0.222 | 0.556 | 0.222 | 0.000 | 0.000 | 0.778 | 0.034 | 0.052 | 0.190 | 0.724 | |
| 2 | 1 | 0.674 | 0.304 | 0.022 | 0.000 | 0.357 | 0.500 | 0.071 | 0.071 | 0.805 | 0.161 | 0.011 | 0.023 |
| 2 | 0.250 | 0.515 | 0.176 | 0.059 | 0.154 | 0.346 | 0.385 | 0.115 | 0.167 | 0.592 | 0.225 | 0.017 | |
| 3 | 0.118 | 0.196 | 0.549 | 0.137 | 0.045 | 0.091 | 0.500 | 0.364 | 0.016 | 0.203 | 0.626 | 0.154 | |
| 4 | 0.000 | 0.043 | 0.087 | 0.870 | 0.000 | 0.000 | 0.222 | 0.778 | 0.010 | 0.051 | 0.153 | 0.786 | |
| 3 | 1 | 0.740 | 0.260 | 0.000 | 0.000 | 0.455 | 0.364 | 0.091 | 0.091 | 0.692 | 0.282 | 0.013 | 0.013 |
| 2 | 0.280 | 0.480 | 0.200 | 0.040 | 0.176 | 0.294 | 0.471 | 0.059 | 0.130 | 0.652 | 0.174 | 0.043 | |
| 3 | 0.082 | 0.219 | 0.548 | 0.151 | 0.077 | 0.231 | 0.308 | 0.385 | 0.017 | 0.182 | 0.645 | 0.157 | |
| 4 | 0.019 | 0.074 | 0.148 | 0.759 | 0.000 | 0.100 | 0.200 | 0.700 | 0.009 | 0.026 | 0.183 | 0.783 | |
| 4 | 1 | 0.833 | 0.133 | 0.033 | 0.000 | 0.600 | 0.400 | 0.000 | 0.000 | 0.838 | 0.162 | 0.000 | 0.000 |
| 2 | 0.207 | 0.517 | 0.241 | 0.034 | 0.056 | 0.389 | 0.556 | 0.000 | 0.120 | 0.652 | 0.163 | 0.065 | |
| 3 | 0.049 | 0.246 | 0.557 | 0.148 | 0.000 | 0.111 | 0.500 | 0.389 | 0.010 | 0.286 | 0.480 | 0.224 | |
| 4 | 0.000 | 0.010 | 0.237 | 0.753 | 0.000 | 0.042 | 0.042 | 0.917 | 0.000 | 0.031 | 0.221 | 0.748 | |
Table 2.
The spatial Markov transfer matrix of UGDE from 2005 to 2015
There was a significant spatial spillover effect in China, with the UGDE of neighboring cities being affected by each other. High-efficiency cities were responsible for a significant positive spillover to neighboring cities. Conversely, inefficient cities had negative spillover effects. Cities adjacent to high-efficiency cities had a higher probability of experiencing an increase in UGDE and a lower probability of experiencing a decrease, and vice versa. Specifically, from 2005 to 2008, the average probability of the upward transfer of UGDE in low-efficiency cities was 0.226. When the neighboring cities had a medium-efficiency or high-efficiency, their transition probability increased to 0.326 and 0.260, respectively. The probability of an upward transfer in UGDE decreased to 0.153 when a city was adjacent to a low-efficiency city. From 2008 to 2009, the probability of upward transfer for a low-efficiency city bordering another low-efficiency city was 0.238. This was lower than the probabilities when bordering a medium-efficiency city, relatively high-efficiency city, and high-efficiency city, which were 0.195, 0.308, and 0.162, respectively. Correspondingly, when a high-efficiency city was adjacent to a low-efficiency city, the probability of a downward transfer was 0.222, which was greater than the probability when a high-efficiency city was adjacent to a high-efficiency city. From 2009 to 2015, the probability of an upward transfer (0.156) for a low-efficiency city adjacent to another low-efficiency city was smaller than the probability (0.162) when it was adjacent to a high efficiency city, and the probability of a downward transfer (0.252) for a high-efficiency city to another high-efficiency city was also smaller than the probability when it was adjacent to a low-efficiency city (0.276). In addition, when a city was adjacent to a different type of city, the probability of the UGDE remaining unchanged was greater than the probability of an upward or downward shift. This shows that there was also a strong “club convergence” phenomenon and a certain spatio-temporal inertia in the various types of spatio-temporal changes.
From 2008 to 2009, the probability of a downward transfer for low-efficiency, medium-efficiency, and high-efficiency cities was higher than in the other two periods, indicating that the regional UGDE had significantly improved. This was in line with the phenomenon whereby the overall UGDE increased from 2008 to 2009, indicating that an increase in the efficiency of specific cities is the key factor influencing the improvement of the overall UGDE. However, the probability of a low-efficiency city being maintained in that state was higher than that of other efficiency types in the three periods, which indicates that under a background of regional spatial dependence, the positive spillover effect between cities is relatively limited in terms of its promotion into underdeveloped areas. In the future, improving the UGDE of low-efficiency cities and promoting the role of positive spillovers should play a large role in the overall improvement of UGDE.
4 Analysis of the UGDE factors influencing in China
There were clear spatio-temporal differentiation characteristics of UGDE, and there were also obvious differences and correlations among different regions, urban agglomerations, and cities. Under the interactive coupling of the “economic-social- environmental” system, the imbalance of natural background conditions and human and social development factors have combined and influenced each other. This has introduced complexity into the process by which the spatial and temporal patterns of the UGDE has changed over time. Therefore, this study started from the regional system of the human-environment interaction, built a model of the factors affecting the UGDE, and systematically quantified the mechanism by which UGDE evolved under the influence of multiple factors (
![]()
Figure 5.The factors influencing the mechanism of UGDE in China
4.1 Model specification and variable selection
The factors influencing UGDE in China were investigated from the perspective of natural background factors and the development of human and social factors, in an attempt to verify the “Kuznets hypothesis” and “Porter hypothesis”. In terms of natural background factors, the initial selection of water, soil, climate, and biological factors were annual precipitation, annual average temperature, PM2.5 concentration, and vegetation cover. These factors represented urban hydrological conditions (
where
4.2 The mechanisms controlling UGDE in China
Models (1), (2), and model (3) are the regression results for human and social factors, natural background conditions, and natural and humanistic factors (
| Variable | Model (1) | Model (2) | Model (3) | ||||
|---|---|---|---|---|---|---|---|
| Human and social factors | 0.025*** | 3.68 | 0.030*** | 4.20 | |||
| 0.013*** | 3.68 | 0.015*** | 4.20 | ||||
| 0.087* | 1.55 | 0.089* | 1.58 | ||||
| 0.007** | 2.07 | 0.005* | 1.50 | ||||
| -0.439*** | -6.64 | -0.453*** | -6.84 | ||||
| Natural | 0.005** | 2.32 | 0.007*** | 3.21 | |||
| -0.004 | -0.67 | -0.001 | -0.40 | ||||
| 0.0001 | 0.28 | 0.0004 | 0.38 | ||||
| 0.119* | 1.67 | -0.027 | 1.01 | ||||
| 0.212*** | -3.71 | 0.723*** | -3.62 | 0.099*** | 1.01 | ||
| Correlation test | sigma_u | 0.181 | 0.187 | 0.178 | |||
| sigma_e | 0.139 | 0.141 | 0.139 | ||||
| rho | 0.628 | 0.638 | 0.621 | ||||
| likelihood ratio test | 1305.72 | 1262.74 | 1312.67 |
Table 3.
The estimation of the factors influencing UGDE in China
The coefficient of the square of per capita GDP was 0.068, which was significant at the 99% level, indicating that there was a “U-shaped” relationship between economic development and UGDE. Therefore, UGDE can be seen as a means of environmental regulation in the context of the construction of an ecological civilization and GD policies. An increase in efficiency will reduce environmental pollution, and can therefore act as a negative indicator of environmental pollution. Then, the EKC between environmental pollution and economic development could be interpreted based on the “U-shaped” relationship between UGDE and economic development, i.e., there was an environmental “EKC” effect between GD and economic growth in Chinese cities from 2005 to 2015. Opening to the outside world (
With the continuous introduction of scientific development and the concept of sustainable development, the Chinese government has taken multiple factors into consideration regarding foreign investment. It must meet the needs of economic development but this must not be at the expense of the environment. This phenomenon is a good illustration of the change in the role of the state and the government’s use of foreign investment since reform and opening up was initiated in 1978, which is gradually meeting the requirements of constructing an ecological civilization and GD policies. Technological innovation can play an important role in solving environmental problems and maintaining increases in productivity. Using UGDE as a means of environmental regulation has a significant negative effect on technological innovation. The corresponding “Porter Hypothesis” advocates a proactive environmental protection policy and suggests that strict and appropriate environmental regulations can stimulate enterprises to carry out technological innovation. The resulting innovation benefits can offset or even exceed environmental protection costs, thereby ensuring or improving the competitiveness of enterprises. Improving the UGDE as a means of environmental regulation has not only played an active role in promoting technological innovation in cities, but has also greatly inhibited the improvement of technological innovation at the national level. This is an obvious “green paradox”, and the “inverted mechanism” of technological innovation has not yet developed to resolve it. According to the Porter hypothesis, environmental regulation has a positive effect on technological innovation and even the competitiveness of enterprises, but this is conditional on the economic level of a country or region having developed to a certain degree. Only then can the situation described by the “Porter Hypothesis” occur.
5 Conclusions and discussion
5.1 Conclusions
(1) From 2005 to 2015, the average UGDE in China has been at an intermediate level, from 0.475 in 2005 to 0.523 in 2015, an overall increase of 10%. Changes of UGDE have occurred over three time periods. From 2005 to 2008, UGDE gradually decreased, while regional differences continued to expand. From 2008 to 2009, UGDE increased rapidly, while regional differences narrowed rapidly. From 2009 to 2015, UGDE development was relatively balanced.
(2) The trend of UGDE was considered in three regions (east, central, and western) and presented a “W-shaped” pattern, with mean values of 0.548, 0.475, and 0.428, respectively. There were stepwise decreasing characteristics of UGDE observed that followed a “eastern-central-western” pattern. The UGDE of multi-level urban agglomerations followed an inverted pyramid pattern of “national level > regional level > local level”, and the hierarchical structural characteristics of “super cities > mega cities > large cities > medium cities > small cities” was prominent.
(3) The UGDE was found to have a significant spatial spillover effect, whereby the UGDE of one city could influence the UGDE of an adjacent city. There was a strong “spatial club convergence” phenomenon and a certain spatio-temporal inertia in the various types of transfers. High-efficiency cities resulted in significant positive spillovers to their neighbors, while low-efficiency cities had negative spillover effects. Cities adjacent to high-efficiency cities had a higher probability of transferring upward and a lower probability of transferring downward.
(4) From the perspective of the regional human-environment interaction system, technological innovation was the core driving factor and had a significant negative effect on the UGDE. Economic strength, industrial structure, and openness had positive impacts on UGDE, but the degree of impact decreased over the study period. Among the natural background factors, the influence of urban temperature was positive, while hydrological conditions, environmental quality, and ecological suitability had no significant effect on UGDE.
(5) It was assumed that UGDE acted as a means of environmental regulation. Economic development and UGDE displayed a “U-shaped” relationship, and there was a clear EKC effect. Openness was significantly positively related to UGDE. There was no obvious pollution transfer effect generated by foreign investment, but investment would improve the environmental quality and a “pollutant shelter” would not be established accordingly. Technological innovation had a significant inhibitory effect on the improvement of GDE. It would be impossible to improve environmental quality by technological innovation at this stage in China’s development.
5.2 Discussion
The UGDE was considered to act as an environmental regulation in this study. The degree of UGDE reflects the quality of the natural environment and the level of urban environmental regulation. Its spatio-temporal pattern and its influencing factors are of significance for the overall control and promotion of Chinese urban GD and the construction of an ecological civilization. It can also be used to verify whether the developmental theories of western developed countries have been incorporated in the actual development of China. At present, China generally displays an EKC effect, i.e., environmental pollution is continuing to increase while the economy is developing. The results of this study will be important in the next stage of supply-side reform, economic restructuring, elimination of primitive production methods, and the development of environmental protection strategies to achieve the decoupling of economic growth and environmental pollution. In addition, a nationwide “pollutant shelter” effect could not be confirmed, which was related to the structural screening of Chinese foreign investment. This also reflects the fact that China is currently faced with economic and environmental problems that are largely a consequence of its own endogenous factors. How to adjust the relationship between internal development and pollution has become the most important issue in achieving GD. The “Porter Hypothesis” could not be verified in China at this stage. The external benefits of technological innovation could not offset the development costs of the current competitiveness of cities in China, resulting in proactive environmental protection policies failing to encourage enterprises to carry out technological innovation, and inhibiting economic growth to a certain extent. There was no conflict between the implementation of environmental protection and economic growth. The key lies in how to resolve the relationship between the cost of externalities and technological innovation. How to effectively handle the relationships between environmental protection, technological innovation, and economic growth will have a major impact on the sustainable development of GD.
The formation of the spatio-temporal pattern of UGDE was found to be affected by the combination of natural backgrounds and human economic factors. The interaction of these factors has resulted in a complex human-environment in China. Each factor through its own evolution or mutual coupling and coercion with other factors, continuously shapes the internal development of the urban system, affects the process of urban greening, and influences the improvement of UGDE. The study attempted to expand the logic of “pattern-process-cause” that is applied in the geographical research framework of human-land relations to provide new ideas for urban “fair”, “inclusive” and “green” sustainable development. This goal is consistent with the construction of an ecological civilization and GD, and it provides methodological support to further enrich the theory of human-land relationships and practically solve ecological and environmental problems.
References
[4] International trade and the environment: Policy reform in a polluted small open economy. Journal of Environmental Economics & Management, 26, 44-65(1994).
[8] Environmental impacts of a North American Free Trade Agreement. Social Science Electronic Publishing, 8, 223-250(1992).
[9] . Urban and Regional Planning Research: Green Development and Urban Planning Reform(2015).
[11] Mechanism of financial development influencing regional green development: Based on eco-efficiency and spatial econometrics. Geographical Research, 33, 532-545(2014).
[12] The Marxist green development concept and green development in contemporary China: Comment on incompatibility theory between environment and development. Economic Research Journal, 52, 17-30(2017).
[16] Chinese enterprise green transition: Target pattern, obstacles and countermeasures. China Population Resources and Environment, 25, 1-4(2015).
[17] Measurement and convergence analysis of green water utilization efficiency. Journal of Natural Resources, 32, 406-417(2017).
[18] Satellite images show China going green. Nature, 553, 411-413(2018).
[20] Energy: OECD Green growth studies. OECD Publishing(2012).
[21] . Our Common Future(1987).
[24] Exploring the link between research and economic growth: An empirical study of China and USA. Quality & Quantity, 50, 1073-1091(2016).
[25] . Report on the Development of Small and Medium-sized Cities in China: Green Development of Small and Medium-sized Cities(2010).
[31] et alThe green efficiency of industrial sectors in China: A comparative analysis based on sectoral and supply-chain quantifications. Resources Conservation & Recycling, 132, 269-277(2017).
[34] et alPrediction and analysis of the transition to green economy in China based on the theory of ecosystem services. Acta Ecologica Sinica, 34, 7137-7147(2014).
[35] et alMulti-scenario simulation of urban land change in Shanghai by random forest and CA-Markov model. Sustainable Cities and Society, 55, 1-10(2020).


Set citation alerts for the article
Please enter your email address

© Copyright 2018-2021 | Chinese Laser Press. All Rights Reserved 沪ICP备15018463号-20