Author Affiliations
1Donghai Institute, Ningbo University, Ningbo 315211, Zhejiang, China2Department of Geography & Spatial Information Techniques, Ningbo University, Ningbo 315211, Zhejiang, China3School of Geosciences, University of South Florida, Tampa, FL 33620-5250, USAshow less
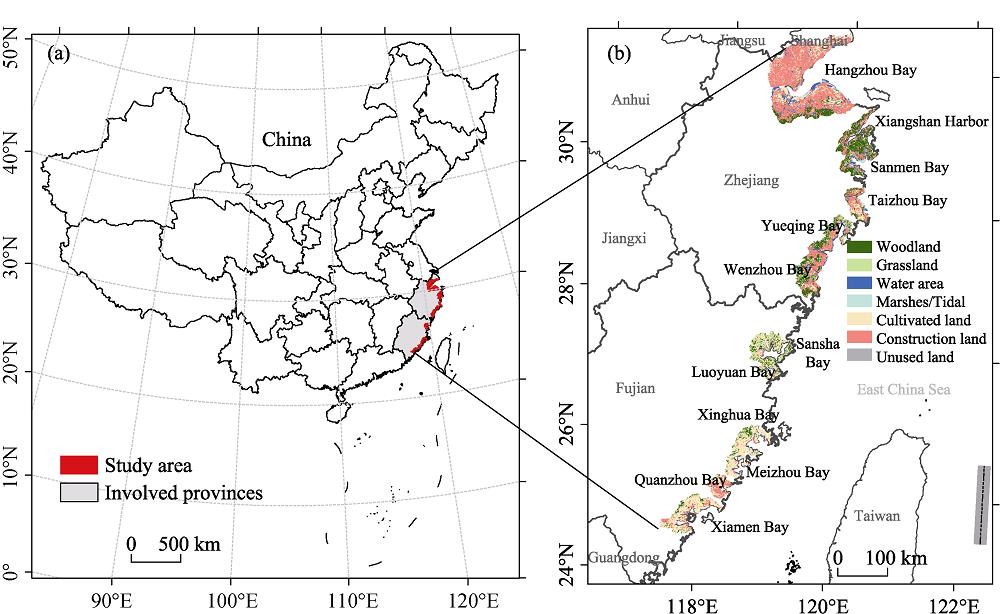
Fig. 1. Geographic location of the study area (a) and distribution of land-use types in 2015 (b)
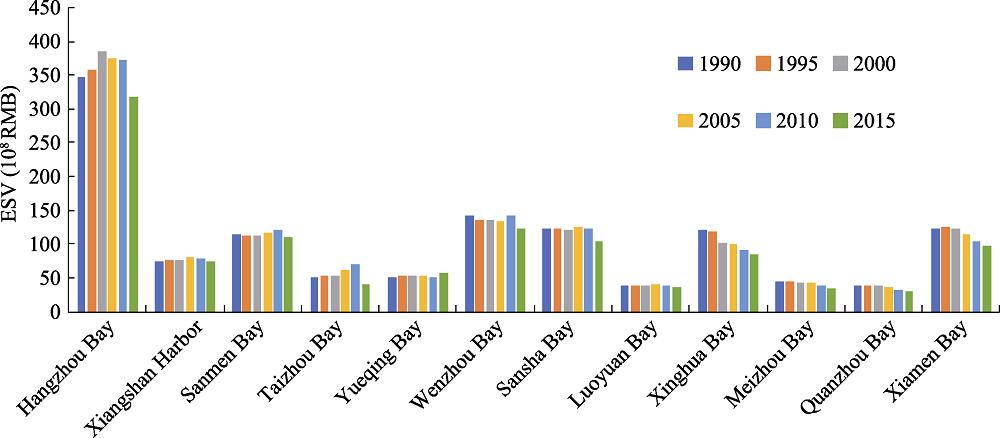
Fig. 2. ESVs in the bays in East China Sea during the period 1990-2015
Fig. 3. The variation of ESVs in the bays in East China Sea during the period 1990-2015
Fig. 4. The spatial differentiation of ESV in the northern bays in East China Sea
Fig. 5. The spatial differentiation of ESV in the southern bays in East China Sea
Fig. 6. The change of the reclamation intensity in the bays in East China Sea (Note: a - Northern bays in East China Sea, and a - 1 to 6 are Hangzhou Bay, Xiangshan Harbor, Sanmen Bay, Taizhou Bay, Yueqing Bay and Wenzhou Bay in turn. b - Southern Bay in East China Sea, and b - 1 to 6 are Sansha Bay, Luoyuan Bay, Xinghua Bay, Meizhou Bay, Quanzhou Bay and Xiamen Bay in turn. The curves of the bays where sea reclamation intensity exceeded 40 hm2/km were marked in red.)
Fig. 7. Relationship between sea reclamation intensity and ESV of the bays in East China Sea (Note: a - Northern bays in East China Sea, and a - 1 to 6 is Hangzhou Bay, Xiangshan Harbor, Sanmen Bay, Taizhou Bay, Yueqing Bay and Wenzhou Bay in turn. b - Southern bays of East China Sea, and b - 1 to 6 is Sansha Bay, Luoyuan Bay, Xinghua Bay, Meizhou Bay, Quanzhou Bay and Xiamen Bay in turn. Marked in red indicates high correlation.)
Fig. 8. Correlations between sea reclamation intensity and ESV of the bays in East China Sea(Note: a - Northern bays in East China Sea, b - Southern bays in East China Sea)
| Ecosystem classification | Supply service | Regulating service | Supporting service | Cultural service | Total |
|---|
| Ecosystemtypes | Corresponding land types | Food production | Raw material production | Gas regulation | Climate regulation | Hydrological regulation | Environment purification | Soil conservation | Bio-diversitymaintenance | Aesthetic landscape |
|---|
| Forest | Woodland | 20.40 | 59.88 | 14.26 | 67.99 | 51.76 | 39.04 | 194.33 | 83.35 | 39.48 | 570.48 | | Grassland | Grassland | 26.98 | 4.17 | 6.36 | 25.00 | 4.17 | 35.09 | 52.86 | 78.96 | 7.90 | 241.48 | | Waters | Waters | 16.89 | 2.41 | 1.32 | 14.91 | 2697.32 | 2.19 | 4.83 | 19.08 | 87.07 | 2846.03 | | Wetland | Marshes/ Tidal flat/ Mangrove forests | 6.58 | 1.54 | 39.48 | 375.05 | 339.96 | 398.74 | 37.51 | 54.83 | 121.73 | 1375.42 | | Desert/ bare land | Unused land | 0.00 | 0.22 | 3.73 | 2.63 | 0.00 | 0.22 | 0.00 | 1.54 | 0.44 | 8.77 | | Farmland | Cultivated land | 21.93 | 2.19 | 2.85 | 21.93 | 2.85 | 3.73 | 37.29 | 21.93 | 1.32 | 116.02 |
|
Table 1. Ecosystem service value coefficient (104 RMB/km2/yr)
| PD value (hm2/km) | Strength grade | Meaning |
|---|
| 0≤PD<10 | Grade 1 | Sea reclamation pressure is light and development potential is great. | | 10≤PD<20 | Grade 2 | Sea reclamation pressure is low with a certain development potential. | | 20≤PD<50 | Grade 3 | Certain sea reclamation pressure exists with a certain effect on the subsequent development. | | 50≤PD<100 | Grade 4 | Sea reclamation pressure is strong and attention should be paid to conservation and intensive use of sea reclamation areas. | | PD≥100 | Grade 5 | Sea reclamation pressure is very strong. No new sea reclamation projects should be added, and when necessary, it can be conducted based on the existing sea reclamation projects. |
|
Table 2. Intensity grades of sea reclamation
| ESV(108 RMB) | 1990 | 1995 | 2000 | 2005 | 2010 | 2015 | 1990-2000 | 2000-2010 | 1990-2015 |
|---|
| Variation(108 RMB) | Rate of change (%) | Variation(108 RMB) | Rate of change (%) | Variation(108 RMB) | Rate of change (%) |
|---|
| Northern bays in East China Sea | 781.83 | 790.23 | 817.79 | 822.74 | 834.80 | 724.35 | 35.96 | 4.60 | 17.01 | 2.08 | -57.49 | -7.35 | | Southern bays in East China Sea | 488.21 | 488.16 | 464.62 | 456.44 | 429.47 | 389.50 | -23.59 | -4.83 | -35.15 | -7.57 | -98.71 | -20.22 | | Total | 1270.04 | 1278.38 | 1282.41 | 1279.17 | 1264.27 | 1113.84 | 12.37 | 0.97 | -18.14 | -1.41 | -156.20 | -12.30 |
|
Table 3. Dynamic change of ESV of the northern / southern bays in East China Sea
| Ecosystemtypes | 1990 | 1995 | 2000 | 2005 | 2010 | 2015 | Variation(108 RMB) | Rate of change (%) |
|---|
| Northern bays | Forest | 270.45 | 275.50 | 275.01 | 273.00 | 270.10 | 269.54 | -0.91 | -0.34 | | Grassland | 8.94 | 8.73 | 9.28 | 9.18 | 9.30 | 9.84 | 0.90 | 10.07 | | Waters | 179.63 | 206.90 | 254.04 | 301.36 | 375.24 | 296.27 | 116.64 | 64.94 | | Wetland | 201.55 | 182.73 | 162.19 | 132.72 | 77.95 | 49.22 | -152.33 | -75.58 | | Desert/bare land | 0.00 | 0.01 | 0.00 | 0.00 | 0.00 | 0.00 | 0.00 | -54.53 | | Farmland | 121.25 | 116.35 | 117.27 | 106.47 | 102.19 | 99.47 | -21.78 | -17.96 | | Total | 781.83 | 790.23 | 817.78 | 822.74 | 834.80 | 724.35 | -57.48 | -7.35 | | Southern bays | Forest | 182.96 | 185.68 | 187.02 | 186.21 | 184.78 | 185.03 | 2.07 | 1.13 | | Grassland | 22.30 | 21.63 | 21.78 | 20.66 | 20.65 | 20.64 | -1.66 | -7.44 | | Waters | 175.49 | 182.94 | 160.74 | 171.54 | 159.85 | 129.72 | -45.77 | -26.08 | | Wetland | 69.72 | 61.46 | 58.33 | 45.27 | 33.19 | 25.96 | -43.76 | -62.77 | | Desert/bare land | 0.01 | 0.01 | 0.01 | 0.01 | 0.01 | 0.01 | 0.00 | 0.00 | | Farmland | 37.71 | 36.44 | 36.75 | 32.76 | 30.99 | 28.14 | -9.57 | -25.38 | | Total | 488.21 | 488.15 | 464.61 | 456.44 | 429.46 | 389.48 | -98.73 | -20.22 | | Total | Forest | 453.41 | 461.18 | 462.03 | 459.21 | 454.88 | 454.57 | 1.16 | 0.26 | | Grassland | 31.24 | 30.36 | 31.06 | 29.84 | 29.95 | 30.48 | -0.76 | -2.43 | | Waters | 355.12 | 389.84 | 414.78 | 472.90 | 535.09 | 425.99 | 70.87 | 19.96 | | Wetland | 271.27 | 244.19 | 220.52 | 177.99 | 111.14 | 75.18 | -196.09 | -72.29 | | Desert/bare land | 0.01 | 0.02 | 0.01 | 0.01 | 0.01 | 0.01 | 0.00 | -8.33 | | Farmland | 158.96 | 152.79 | 154.02 | 139.23 | 133.18 | 127.61 | -31.35 | -19.72 | | Total | 1270.04 | 1278.38 | 1282.39 | 1279.18 | 1264.26 | 1113.83 | -156.21 | -12.30 |
|
Table 4. Changes of ESV of various ecosystems in the bays in East China Sea
| Northern bays | Grade of reclamation intensity at early stage of study | Grade of reclamation intensityat late stage of study | Southern bays | Grade of reclamation intensity at early stage of study | Grade of reclamation intensityat late stage of study |
|---|
| Hangzhou Bay | Grade 3 | Grade 5 | Sansha Bay | Grade 2 | Grade 3 | | Xiangshan Harbor | Grade 1 | Grade 2 | Luoyuan Bay | Grade 1 | Grade 3 | | Sanmen Bay | Grade 1 | Grade 3 | Xinghua Bay | Grade 1 | Grade 3 | | Taizhou Bay | Grade 1 | Grade 5 | Meizhou Bay | Grade 1 | Grade 3 | | Yueqing Bay | Grade 1 | Grade 3 | Quanzhou Bay | Grade 1 | Grade 1 | | Wenzhou Bay | Grade 1 | Grade 4 | Xiamen Bay | Grade 1 | Grade 3 |
|
Table 5. The intensity grade of reclamation in the bays in East China Sea