
Ruiqing LIU, Hao XU, Jialin LI, Ruiliang PU, Chao SUN, Luodan CAO, Yimei JIANG, Peng TIAN, Lijia WANG, Hongbo GONG. Ecosystem service valuation of bays in East China Sea and its response to sea reclamation activities[J]. Journal of Geographical Sciences, 2020, 30(7): 1095
- Journal of Geographical Sciences
- Vol. 30, Issue 7, 1095 (2020)
Abstract
1 Introduction
As a sea area that goes deep in the land to form an obvious water bend, the bay is an important constituent part of ocean (
Even though China has formulated the policy of compensable use of sea reclamation, the economic outcome of sea reclamation is first evaluated while the ecosystem service value loss is often neglected. A study on a relationship between sea reclamation activities and ESVs in bays enables people to rethink and weigh the pros and cons of sea reclamation, minimizes the loss of ecological service value, strengthens comprehensive bay management based on ecosystem level and maintains regional ecological security of the bays. Currently, scholars in the world have conducted many studies regarding ecosystem service supply and its response to human activities, and thus this has become one of critical research hotspots related to regional ecological security pattern coupling ecological services (
East China Sea is the area with rapid economic growth and the fastest urbanization progress and a key area for extension of blue economic space, in which human economic activities are intensive. There are significant differences in bay types, coastal natural properties, socio-economic development status and sea reclamation modes. Therefore, evaluating service values of different bay ecosystems under the effect of sea reclamation can complement relevant research on ecological evaluations in bays. Based on land use information over the 25 years, this study selected main bays in East China Sea, and quantitatively analyzed the spatiotemporal evolution of ESVs of the bays and their response to sea reclamation intensity, expecting to provide a scientific support for reasonable development of bay resources in East China Sea, eco-compensation formulation and decision making for bay protection.
2 Data and methodology
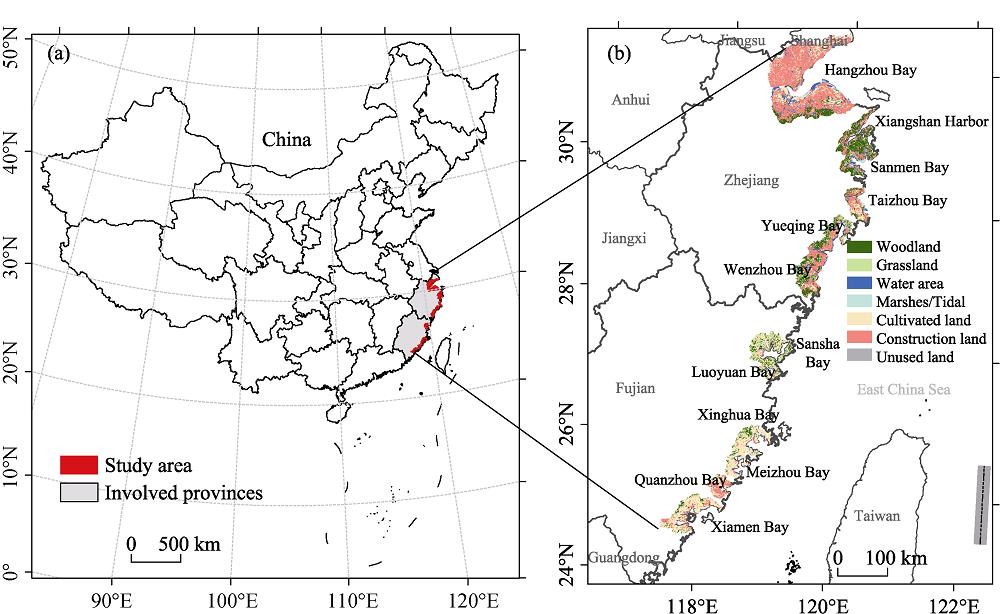
2.1 Study area
The shoreline of the sea area under the jurisdiction of East China Sea is long, and bay types are abundant. East China Sea is the sea area with the largest number of bays in China, having abundant biological, islands and reef sand landscape resources and evident regional advantages. As one of the important sea areas in China's ecological civilization and marine reserve construction (
![]()
Figure 1.
2.2 Datasets and preprocessing
Land use data in this study were obtained from national geographical status monitoring cloud platform (
2.3 Ecosystem service classification and value evaluation method
There is still a divergence in the ecosystem service classification, and indicator systems and methods for quantitative evaluation of ESVs are still not unified in China (
Equivalent weight factor method was used as the ESV evaluation method based on different land use types in this study area. In order to improve the accuracy of evaluation results, this study used the research results of
where
| Ecosystem | Supply service | Regulating service | Supporting | Cultural service | Total | ||||||
|---|---|---|---|---|---|---|---|---|---|---|---|
| Ecosystem | Corresponding land types | Food production | Raw material production | Gas regulation | Climate regulation | Hydrological regulation | Environment purification | Soil conservation | Bio- | Aesthetic landscape | |
| Forest | Woodland | 20.40 | 59.88 | 14.26 | 67.99 | 51.76 | 39.04 | 194.33 | 83.35 | 39.48 | 570.48 |
| Grassland | Grassland | 26.98 | 4.17 | 6.36 | 25.00 | 4.17 | 35.09 | 52.86 | 78.96 | 7.90 | 241.48 |
| Waters | Waters | 16.89 | 2.41 | 1.32 | 14.91 | 2697.32 | 2.19 | 4.83 | 19.08 | 87.07 | 2846.03 |
| Wetland | Marshes/ Tidal flat/ Mangrove forests | 6.58 | 1.54 | 39.48 | 375.05 | 339.96 | 398.74 | 37.51 | 54.83 | 121.73 | 1375.42 |
| Desert/ bare land | Unused land | 0.00 | 0.22 | 3.73 | 2.63 | 0.00 | 0.22 | 0.00 | 1.54 | 0.44 | 8.77 |
| Farmland | Cultivated land | 21.93 | 2.19 | 2.85 | 21.93 | 2.85 | 3.73 | 37.29 | 21.93 | 1.32 | 116.02 |
Table 1.
Ecosystem service value coefficient (104 RMB/km2/yr)
2.4 Sea reclamation intensity and classification
Sea reclamation intensity index, which is defined as a sea reclamation area per unit length of coastline (
where
| PD value (hm2/km) | Strength grade | Meaning |
|---|---|---|
| 0≤PD<10 | Grade 1 | Sea reclamation pressure is light and development potential is great. |
| 10≤PD<20 | Grade 2 | Sea reclamation pressure is low with a certain development potential. |
| 20≤PD<50 | Grade 3 | Certain sea reclamation pressure exists with a certain effect on the subsequent development. |
| 50≤PD<100 | Grade 4 | Sea reclamation pressure is strong and attention should be paid to conservation and intensive use of sea reclamation areas. |
| PD≥100 | Grade 5 | Sea reclamation pressure is very strong. No new sea reclamation projects should be added, and when necessary, it can be conducted based on the existing sea reclamation projects. |
Table 2.
Intensity grades of sea reclamation
3 Results and Analysis
3.1 Spatiotemporal evolution of ESVs of bays in East China Sea under the effect of sea reclamation
3.1.1 Temporal change of ESVs
In general, ESVs of the bays in East China Sea presented a declining tendency during the period of 1990-2015, cumulatively by RMB 156.20×10⁸ with a change rate reaching 12.30%, indicating that the whole ecosystem in East China Sea was continuously degraded over the 25 years. The ESV showed a slight increase before 2000, a total increase of 0.97%, and then, it showed a significant decrease, which embodied instability of bay ecosystem in East China Sea under human interference to a certain degree (
| ESV | 1990 | 1995 | 2000 | 2005 | 2010 | 2015 | 1990-2000 | 2000-2010 | 1990-2015 | |||
|---|---|---|---|---|---|---|---|---|---|---|---|---|
| Variation | Rate of change (%) | Variation | Rate of change (%) | Variation | Rate of change (%) | |||||||
| Northern bays in East China Sea | 781.83 | 790.23 | 817.79 | 822.74 | 834.80 | 724.35 | 35.96 | 4.60 | 17.01 | 2.08 | -57.49 | -7.35 |
| Southern bays in East China Sea | 488.21 | 488.16 | 464.62 | 456.44 | 429.47 | 389.50 | -23.59 | -4.83 | -35.15 | -7.57 | -98.71 | -20.22 |
| Total | 1270.04 | 1278.38 | 1282.41 | 1279.17 | 1264.27 | 1113.84 | 12.37 | 0.97 | -18.14 | -1.41 | -156.20 | -12.30 |
Table 3.
Dynamic change of ESV of the northern / southern bays in East China Sea
From the southern and northern bays in East China Sea, the ESV in the northern bays firstly increased and then declined, it was elevated during the period of 1990-2000 to a great extent, reaching 4.60%, and then the increase slowed down and eventually showed a downward trend (
From the perspective of various bays in East China Sea, during the period of 1990-2015, the ESVs of other bays declined to varying degrees, except for the increase of ESV in Yueqing Bay (Figures 2 and 3). (1) The main cause for increasing ESV in Yueqing Bay was sharp rise of water body ecosystem, and value change rate of the water body reached as high as 288.28% during the 25 years; the increase of water value was mainly derived from mudflat reclamation and sea reclamation activities around Yueqing Bay, and, as a result, aquaculture land area was enlarged by a large margin and regional ESV was increased finally. (2) The largest decrease in value was in Xinghua Bay, with a cumulative decrease of RMB 34.63×10⁸ during this period, and change rate was 28.79%. During the period 1995-2000, there were seawall construction and land reclamation in Xinghua Bay. Water and wetland reduction caused by sea reclamation was the main cause for a rapid ESV decrease in Xinghua Bay. (3) The minimum value decrement was in Xiangshan Harbor, a total of RMB 0.36×10⁸, with a change rate of only -0.47%, and during the whole period, value change of Xiangshan Harbor was relatively stable, mainly because the internal environment of Xiangshan Harbor was stable, and, meanwhile, Xiangshan Harbor had ecological protection restrictions for development, so that there was almost no change in ESV. (4) The bay with the highest ESV was Hangzhou Bay. Before 2000, the total ESV in Hangzhou Bay presented a rising tendency and then gradually declined, which was related to enhanced bay development and utilization intensity and large increment of sea reclamation scale and intensity in Hangzhou Bay. At the early stage of the study, due to the large demand for urbanization development in Hangzhou Bay, a large number of reclamation activities were implemented, which caused abrupt shrinkage of mudflat wetland area and rapid expansion of water areas like aquaculture land area, but at the late construction phase, wetland and water body were gradually transformed into construction land, which then gave rise to gradual ESV decline of Hangzhou Bay. (5) ESV fluctuation of Taizhou Bay was the maximum, showing a trend of large increase then rapid decrease. At south and north shores of Taizhou Bay there were abundant mudflat resources, and early sea use was dominated by aquaculture. Before 2010, sea reclamation land in Taizhou Bay was mainly used for mudflat aquaculture and harbor construction, resulting in a decrease of wetland value and an increase of water value. At the late stage, sea reclamation mode transformed from sea reclamation aquaculture into industrial sea reclamation, resulting in a rapid reduction of ESV in Hangzhou Bay.
![]()
Figure 2.
![]()
Figure 3.
3.1.2 ESV changes of various ecosystem types
Land use change is the main cause of ESVs changes. During the 25 years, the areas of grassland, wetland, unused land and cultivated land in the bays in East China Sea decreased, among which wetland and cultivated land showed a significant downward trend, decreasing by 1082.84 km2 and 2609.90 km2, respectively, while waters increased by 223.96 km2. The land use change in the northern bays in East China Sea was basically consistent with the study area as a whole. The area of waters and grassland increased by 413.37 km2 and 21.88 km2, respectively. Among them, the increased area of waters was the largest. While the area of wetland, cultivated land, forest land and unused land decreased, the wetland decreased the most, reaching 1035.97 km2. However, the land use change in the southern bays in East China Sea is different from that in the northern. As the areas of waters, wetlands, cultivated land and grassland decreased, the decrease range of waters and wetland was the largest, decreasing by 189.4 km2 and 46.87 km2, respectively, followed by cultivated land, while forest land slightly increased.
In bay ecosystems in East China Sea, except for water body and forest land, overall ESV of other ecosystem types showed a downward trend. Among them, service values of water body and wetland fluctuated most remarkably. The maximum ESV increment during the 25 years was water ecosystem, with cumulative increment of RMB 70.87×10⁸ and change rate of 19.96%. The maximum ESV decrement was wetland ecosystem, with cumulative loss of RMB 196.09×10⁸ and reduction rate of 72.29%, followed by farmland ecosystem, with cumulative loss of RMB 31.36×10⁸ (
| Ecosystem | 1990 | 1995 | 2000 | 2005 | 2010 | 2015 | Variation | Rate of | |
|---|---|---|---|---|---|---|---|---|---|
| Northern bays | Forest | 270.45 | 275.50 | 275.01 | 273.00 | 270.10 | 269.54 | -0.91 | -0.34 |
| Grassland | 8.94 | 8.73 | 9.28 | 9.18 | 9.30 | 9.84 | 0.90 | 10.07 | |
| Waters | 179.63 | 206.90 | 254.04 | 301.36 | 375.24 | 296.27 | 116.64 | 64.94 | |
| Wetland | 201.55 | 182.73 | 162.19 | 132.72 | 77.95 | 49.22 | -152.33 | -75.58 | |
| Desert/bare land | 0.00 | 0.01 | 0.00 | 0.00 | 0.00 | 0.00 | 0.00 | -54.53 | |
| Farmland | 121.25 | 116.35 | 117.27 | 106.47 | 102.19 | 99.47 | -21.78 | -17.96 | |
| Total | 781.83 | 790.23 | 817.78 | 822.74 | 834.80 | 724.35 | -57.48 | -7.35 | |
| Southern bays | Forest | 182.96 | 185.68 | 187.02 | 186.21 | 184.78 | 185.03 | 2.07 | 1.13 |
| Grassland | 22.30 | 21.63 | 21.78 | 20.66 | 20.65 | 20.64 | -1.66 | -7.44 | |
| Waters | 175.49 | 182.94 | 160.74 | 171.54 | 159.85 | 129.72 | -45.77 | -26.08 | |
| Wetland | 69.72 | 61.46 | 58.33 | 45.27 | 33.19 | 25.96 | -43.76 | -62.77 | |
| Desert/bare land | 0.01 | 0.01 | 0.01 | 0.01 | 0.01 | 0.01 | 0.00 | 0.00 | |
| Farmland | 37.71 | 36.44 | 36.75 | 32.76 | 30.99 | 28.14 | -9.57 | -25.38 | |
| Total | 488.21 | 488.15 | 464.61 | 456.44 | 429.46 | 389.48 | -98.73 | -20.22 | |
| Total | Forest | 453.41 | 461.18 | 462.03 | 459.21 | 454.88 | 454.57 | 1.16 | 0.26 |
| Grassland | 31.24 | 30.36 | 31.06 | 29.84 | 29.95 | 30.48 | -0.76 | -2.43 | |
| Waters | 355.12 | 389.84 | 414.78 | 472.90 | 535.09 | 425.99 | 70.87 | 19.96 | |
| Wetland | 271.27 | 244.19 | 220.52 | 177.99 | 111.14 | 75.18 | -196.09 | -72.29 | |
| Desert/bare land | 0.01 | 0.02 | 0.01 | 0.01 | 0.01 | 0.01 | 0.00 | -8.33 | |
| Farmland | 158.96 | 152.79 | 154.02 | 139.23 | 133.18 | 127.61 | -31.35 | -19.72 | |
| Total | 1270.04 | 1278.38 | 1282.39 | 1279.18 | 1264.26 | 1113.83 | -156.21 | -12.30 |
Table 4.
Changes of ESV of various ecosystems in the bays in East China Sea
ESV changes of various ecosystem types in the northern bays were consistent with those in East China Sea, mainly because the northern bays accounted for a large proportion in the study area, and their ESV changes would generate a significant effect on overall ESV in East China Sea. During the 25 years, ESVs of water body and grassland in the northern bays increased somehow, while those of wetland, farmland and forest land were reduced. The ESV increment of water body was the maximum, with a change rate of 64.94%. In the northern bays in East China Sea there were mostly silty shorelines with broad mudflat area, so the main sea reclamation mode was mudflat reclamation. During the study period, sea reclamation activities were in full swing in the northern bays, so as to form large-area reclaimed pond water, leading to a large increment of ESV of water body. During the sea reclamation process, mudflat wetland was reclaimed in quantity as the most available land resource, resulting in that wetland area was rapidly reduced and thus ESV was markedly reduced.
ESV change features of various ecosystem types in the southern bays in East China Sea were different from those in the northern bays, manifested by reduction of ESVs of water body, wetland, farmland and grassland as well as small increment of forest land ESV. During the period of 1990-2015, water body presented a significant fluctuating tendency with alternation of increase and decrease, but wetland was displayed as a continuous declining tendency. In the southern bays in East China Sea were mostly bedrock coasts, and mudflat siltation existed only on partial silty coasts, so the main sea reclamation form in the southern bays in East China Sea was sea reclamation, accompanied by reclamation of a small quantity of mudflats, which led to a large number of wetlands and water bodies converted into construction land, and consequently this was a main cause for reduction of water and wetland values.
3.1.3 Spatial variation and evolution of ESVs
Interpolation and simulation were carried out via Kringing method by constructing a 1.5 km ×1.5 km fishing net. ESVs were uniformly divided (unit: RMB 104/km2) into five levels: low (ESV<200), relatively low (200≤ESV<400), medium (400≤ESV<800), relatively high (800≤ESV<1300) and high (ESV>1300), and ESV spatial variation graphs in East China Sea during different periods of 1990-2015 were obtained (Figures 4 and 5).
![]()
Figure 4.
![]()
Figure 5.
Spatial zoning of ESVs of the bays in East China Sea was remarkable, which clearly indicates spatial variation of ESV in various bays. Low-ESV area was expanded, showing the expansion from low-value area to high-value area and outward from cities and from inland towards coastal areas. High-ESV areas were mainly distributed in offshore areas in the bays while low-value areas were mainly distributed in areas with extensive distribution of construction land and cultivated land (Figures 4 and 5). During the 25 years, the areas where ESVs experienced significant changes were generally centralized at sea-land borders, and these areas were usually replaced by low-ESV areas from high-ESV areas and relatively high-ESV areas. The high-ESV areas were mainly distributed in areas with surface features like water bodies and wetlands. Due to the regional development needs of coastal areas, coastal water bodies and wetlands were occupied in quantity and they were gradually transformed into construction land, aquaculture land and cultivated land, and this was the primary cause for ESV reduction in high-value areas. This common phenomenon further indicated that since 1990, sea reclamation-centered human activities had been the main agents for ESV evolution in the bays in East China Sea, and their influence degree was much higher than the effect of natural agents on bay ecosystems.
Among the northern bays in East China Sea, ESV spatial variation and evolution in Hangzhou Bay and Taizhou Bay went through significant changes, followed by Wenzhou Bay, while the ESV of Xiangshan Harbor had the lowest change and the smallest overall difference (
In the southern bays in East China Sea, ESV of Xinghua Bay presented a most significant declining tendency, followed by Meizhou Bay, Quanzhou Bay and Xiamen Bay, but ESVs of Sansha Bay and Luoyuan Bay were stable only with a small decrease amplitude (
3.2 Correlation analysis between ESVs of the bays and sea reclamation intensity
3.2.1 Intensity change of sea reclamation activities in the bays
By analyzing changes in sea reclamation intensity index of bays in East China Sea, it is found that during the period of 1995-2015, sea reclamation intensity indicators of the bays in East China Sea were manifested as a continuous increasing tendency, meaning that with the rapid urbanization, sea reclamation intensity kept rising in all bays in East China Sea, and the area covered by sea reclamation activities was continuously expanded, which resulted in the overall sea reclamation scale in East China Sea (
| Northern bays | Grade of reclamation intensity | Grade of reclamation intensity | Southern bays | Grade of reclamation intensity | Grade of reclamation intensity |
|---|---|---|---|---|---|
| Hangzhou Bay | Grade 3 | Grade 5 | Sansha Bay | Grade 2 | Grade 3 |
| Xiangshan Harbor | Grade 1 | Grade 2 | Luoyuan Bay | Grade 1 | Grade 3 |
| Sanmen Bay | Grade 1 | Grade 3 | Xinghua Bay | Grade 1 | Grade 3 |
| Taizhou Bay | Grade 1 | Grade 5 | Meizhou Bay | Grade 1 | Grade 3 |
| Yueqing Bay | Grade 1 | Grade 3 | Quanzhou Bay | Grade 1 | Grade 1 |
| Wenzhou Bay | Grade 1 | Grade 4 | Xiamen Bay | Grade 1 | Grade 3 |
Table 5.
The intensity grade of reclamation in the bays in East China Sea
![]()
Figure 6.
Among the northern bays in East China Sea, except Xiangshan Harbor that was always beyond grade 2 sea reclamation intensity, the increment of sea reclamation intensity in Hangzhou Bay, Sanmen Bay, Taizhou Bay, Yueqing Bay and Wenzhou Bay was all greater than 20 hm2/km. Those in Hangzhou Bay and Taizhou Bay even exceeded 140 hm2/km, and sea reclamation intensity rose to grade 5, indicating that sea reclamation activities in the northern bays in East China Sea have caused a deep impact on the bay ecosystem, especially due to the pressure on resources and environment in the sea reclamation area. And sea reclamation intensity in Hangzhou Bay and Taizhou Bay already exceeded the maximum sea reclamation area which could be borne by the bay ecosystem, which would produce a severe impact on ecological health, and thus the implementation of sea reclamation projects should be strictly controlled.
Sea reclamation intensity in the southern bays in East China Sea presented a steady growth tendency, but the overall variable quantity of sea reclamation intensity was relatively small, in which the sea reclamation intensity in Quangzhou Bay was the minimum, stabilized within grade 1 interval of sea reclamation intensity with low sea reclamation pressure and large development potential. Sea reclamation intensity in Sansha Bay, Luoyuan Bay, Xinghua Bay, Meizhou Bay and Xiamen Bay was elevated to grade 3, indicating that these bays were already under a certain sea reclamation pressure, but the effect on the bay ecosystem was still within their bearing capacity. The coordination between ecological protection and development and construction in the bays should be kept so as to realize steady development in the bay ecosystem.
In addition, following the year 2000, the sea reclamation intensity of most bays significantly elevated, and during this period, sea reclamation activities were more common in the bays. After 2015, sea reclamation activity intensity largely presented a gentle changing tendency, indicating that national and regional sea reclamation management and control measures had already taken place, and sea reclamation activities were effectively controlled and reduced in the bay areas. Sea reclamation activities were continuously expanded in bays in East China Sea, and sea reclamation intensity presented a rising tendency. In the meantime, during the whole study period, overall ESV in East China Sea was continuously reduced. According to our research findings, ESV and sea reclamation intensity presented a “wane and wax” tendency in East China Sea.
3.2.2 Response of ESVs of the bays to sea reclamation activities
For a further quantitative analysis of the response degree of ESVs of the bays to sea reclamation activities, scatter diagram of a relationship between sea reclamation intensity and ESV was drawn based on sea reclamation intensities in the bays in East China Sea during different time periods, and linear function curves were fitted using the least squares fitting method (Figures 7 and 8).
![]()
Figure 7.
![]()
Figure 8.
The sea reclamation intensity showed a significant correlation with ESVs of the southern bays in East China Sea, which was related to the form of sea reclamation activities. In the southern bays were mostly bedrock shorelines; local sea reclamation activities were mainly land reclamation, and mudflat reclamation only occurred in small areas. Coastal water bodies or some mudflats were directly transformed into construction land through sea reclamation activities, which resulted in continuous drop of ESVs. However, due to high-intensity development and utilization in Fujian Province, the regional land use was in short supply. Therefore, regional development tended to demand land from the sea, which further promoted continuous implementation of sea reclamation activities. Thus, with the elevation of sea reclamation intensity, ESVs of the southern bays in East China Sea tended to continuously decline, which led to a significant correlation between the two variables. The correlation coefficient was partially low in Sansha Bay and Luoyuan Bay because topographic relief in the two bays was large, mainly being forest land, and regional ESV reduction was the main cause for transformation of forest land into construction land. Meanwhile, human development and construction in this area are relatively late, and the reclamation activities were not yet strong. Therefore, the correlation between ESV change and sea reclamation intensity was not significant in Sansha Bay and Luoyuan Bay.
The correlation between sea reclamation intensity and ESVs of the northern bays in East China Sea was generally low because there were mostly silty coasts. The main sea reclamation form was mudflat reclamation, namely converting coastal water bodies or wetlands into construction land, cultivated land or water body in reclaimed ponds, in which the last one was the existing form at the intermediate stage of sea reclamation process, and the service value of water body in the bay ecosystem was the highest, which directly led to elevated ESV within a certain period in the sea reclamation process. Afterwards, the sea reclamation area would be completely transformed into construction land, which would then cause declining tendency of ESV in this period. Therefore, the mudflat reclamation-centered sea reclamation form in the northern bays in East China Sea would result in alternate increasing and declining tendencies of ESVs of the bays, and this was the primary cause for weak correlation between sea reclamation intensity and ESVs of the northern bays in East China Sea.
4 Discussion
4.1 Evolution differences of ESVs of the bays in East China Sea
During the study period, ESVs of the bay ecosystems in East China Sea went through obvious differential evolutions, which was closely related to different economic development patterns and land use modes in the bays. Increasing ESVs in Yueqing Bay was mainly ascribed to mudflat reclamation and land reclamation activities around the Bay so that the area of water bodies in aquaculture ponds was enlarged by a large margin. ESV reduction and the reduction rate were the maximum in Xinghua Bay because Fujian Jiangyin Island in Xinghua Bay was connected with the land to form Jiangyin Peninsula, which directly led to reducing ESVs of water bodies. In the study period, ESVs of Xiangshan Harbor changed little, mainly because Xiangshan Harbor was a long and narrow semi-closed bay with a stable internal environment, and thus the impact of natural forces on coast was small. Restricted by related planning and legal regulations like
4.2 Effects of different sea reclamation modes on ESV evolutions in silty and bedrock bays
In the study period, both the northern bays and southern bays in East China Sea were obviously different in ESV evolution features, which was caused by natural properties like coast type and hydrodynamic conditions (
4.3 Hysteretic effect of sea reclamation activities on the bay ecosystems
From 1990 to 2015, sea reclamation intensity in the bays in East China Sea continued to increase, and their ESVs continued to decrease. The urbanization progress in the bays in East China Sea was abruptly accelerated, accompanied by continuous expansion of sea reclamation activities. Due to the lack of ecosystem level-based comprehensive development planning, urban and town, traffic construction and salt pan aquaculture lands were rapidly expanded, and coastal natural mudflat wetlands, offshore areas and cultivated lands were occupied in a large area (
The effect of sea reclamation activities on the bay ecosystem was both enduring and hysteretic, causing the short-term economic benefit of sea reclamation activities to be much higher than benefits of ESVs loss in the bays, and this was an important reason why sea reclamation activities extensively existed in the bay areas at present. Cumulative negative effects caused by sea reclamation activities on the bay ecosystems like environmental degradation, resource exhaustion and reduction of biodiversity have gradually appeared (
4.4 Application value of ESVs of the bays to ecosystem protection
The response of ESVs of the bays to human sea reclamation activities is extremely significant. Their ESVs present a significant negative correlation with sea reclamation intensity, fully certifying the consistent existence of the contradiction between economic development demand of human society and ecosystem service supply, and this is basically identical with ecosystem service evolution features and patterns caused by extensive land use under the background of rapid urbanization in numerous developing countries (
As a sea-land interface, a bay ecosystem is a typical ecologically sensitive area. In recent years, people have gradually realized the importance of bay protection. The national and local governments have formulated sea reclamation management and control policies and methods in succession to realize strict management and control of sea reclamation projects (
4.5 Limitations of ESV evaluation pattern
The land use information-based evaluation pattern was used to investigate the response relationship between bay ESVs and sea reclamation activities. In the recent decades, land utilization/land cover change has generated an enormous effect on the global bay ecosystem and it is the most direct embodiment of the effect of the current human activities on natural environment of the bays (
5 Conclusions
In this study, a total of 12 main bays in East China Sea were selected. Spatiotemporal evolution features of ESV gain and loss of bay ecosystems in East China Sea under the effect of sea reclamations over the 25 years (1990-2015) were analyzed based on land use data of the bays, and the response degree of ESVs of the bays to sea reclamation intensity was discussed. The conclusions were drawn from analysis results as follows:
(1) ESVs of bays in East China Sea presented a continuous declining tendency, with a decrease of RMB 15.621 billion, reaching 12.30%, indicating that the overall bay ecosystem in East China Sea was continuously degraded during the 25 years. The reduction amplitude of ESVs of southern bays was greater than that of northern bays, and the change difference was related to two sea reclamation activities - inning and land reclamations - of southern and northern bays. Per various bays, their ESVs declined to different degrees. The reduction of ESV of Xinghua Bay was the maximum, with a decrease of RMB 34.63×10⁸, and the rate of change reached 28.79%. The smallest reduction was in Xiangshan Harbor, with a rate of only -0.47%. The ecological service value of Taizhou Bay fluctuated the most. Per ecosystem type, the wetland decreased the most, with a loss of RMB 196.09×10⁸, reaching 72.29%, followed by farmland at RMB 31.36×10⁸.
(2) Spatial zoning of ESVs of bays in East China Sea was significant. A low-ESV area was expanded and the ESVs presented a continuous expanding tendency from low-value area to high-value area. Spatial variation of ESVs of the bays was also remarkable, spatially manifested as expansion outward from cities and expansion from inland to coastal areas. The areas experiencing significant ESV change were centralized at sea-land borders, indicating that, since 1990, coastal human activities centering on sea reclamation had become the main agents for the evolution of ESVs of the bays in East China Sea.
(3) The response of ESVs of the bays in East China Sea to sea reclamation activities was significant. During the 25 years, sea reclamation intensity in the bays in East China Sea continued to enhance and the overall sea reclamation scale was continuously expanded. After 2015, sea reclamation intensity tended to be gentle, manifesting that sea reclamation activities in bay areas in recent years were effectively controlled. The sea reclamation intensity presented a significant negative correlation with ESVs of the bays in East China Sea. The correlation in the southern bays was stronger than that in the northern bays, in which the correlation coefficients of most bays were about 0.9, and this was caused by the different effects of sea reclamation modes on ESV evolution of silty and bedrock bays.
(4) The negative effect of sea reclamation activities on bay ecosystems was hysteretic, and dynamic monitoring and early warning of future development status in offshore areas should be enhanced. By taking a full consideration of socio-economic benefits of sea reclamation, cumulative ecological effect and effect of non-sea reclamation factors in the sea reclamation policy formulation and bay development planning, the government should formulate proper ecosystem level-based sea reclamation management and control policies. For existing coastal wetlands, the irreplaceability of their ESVs should be taken into consideration, and coastal wetland conservation area planning should be added into related governmental planning. The proposed ESV evaluation method has some limitations. The follow-up study should refine the ESV evaluation system of the bays, discussing spatial coupling mechanism of ecological service demand of the bays and their ecological service supply capacity and providing more scientific and reasonable decision-making schemes for regulation of ecological security patterns in the bays.
References
[2] Hungry birds and angry farmers: Using choice experiments to assess “eco-compensation” for coastal wetlands protection in China. Ecological Economics, 154, 71-87(2018).
[3] Shoreline definition and detection: A review. Journal of Coastal Research, 21, 688-703(2005).
[4] On the way and countermeasure of accelerating the construction of marine circular economy in Jiaojiang, Zhejiang Province. Ocean Development and Management, 28, 104-106(2011).
[5] et alChanges of ecosystem service value in a coastal zone of Zhejiang Province, China, during rapid urbanization. International Journal of Environmental Research and Public Health, 15, 1301(2018).
[6] Contribution to Araca Bay management: The identification and valuation of ecosystem services. Ocean & Coastal Management, 164, 128-135(2018).
[7] et alLand reclamation and artificial islands: Walking the tightrope between development and conservation. Global Ecology and Conservation, 12, 80-95(2017).
[9] et alHistorical changes in organic matter input to the muddy sediments along the Zhejiang-Fujian coast, China over the past 160 years. Organic Geochemistry, 111, 13-25(2017).
[11] Dynamics of land use/cover changes and the analysis of landscape fragmentation in Dhaka Metropolitan, Bangladesh. Geojournal, 77, 315-330(2012).
[12] et alAn overview of spatial management and marine protected areas in the East China Sea. Coastal Management, 36, 443-457(2008).
[13] . Annals of Chinese Estuaries(1993).
[14] An indicator system for biodiversity and ecosystem services evaluation in China. Acta Ecologica Sinica, 37, 341-348(2017).
[15] et alPreliminary study on quantitative evaluation method of reclamation intensity and potential. Ocean Development and Management, 27, 27-30(2010).
[16] et alExploring the effect of land use on ecosystem services: The distributive issues. Land Use Policy, 45, 141-149(2015).
[17] et alAssessment of ecological risks induced by land use and land cover changes in Xiamen City, China. International Journal of Sustainable Development and World Ecology, 25, 439-447(2018).
[18] et alAssessing the ecological security of the estuary in view of the ecological services: A case study of the Xiamen Estuary. Ocean & Coastal Management, 137, 12-23(2017).
[19] et alEcosystem service value assessment of coastal zone caused by reclamation: A case study of Ningbo Hangzhou Bay New Zone. Economic Geography, 37, 181-190(2017).
[20] et alEffects of seashore reclamation activities on the health of wetland ecosystems: A case study in the Yellow River Delta, China. Ocean & Coastal Management, 123, 44-52(2016).
[21] Shoreline evolution and management of Hawke's Bay, New Zealand: Tectonics, coastal processes, and human impacts. Journal of Coastal Research, 26, 143-156(2010).
[22] et alHydrodynamic condition and suspended sediment diffusion in the Yellow Sea and East China Sea. Journal of Geophysical Research: Oceans, 121, 6204-6222(2016).
[23] Content, attribution and framework establishment of disciplinary system in marine ecological economics. Journal of Applied Oceanography, 36, 446-454(2017).
[24] et alCoastline and landscape changes in bay areas caused by human activities: A comparative analysis of Xiangshan Bay, China and Tampa Bay, USA. Journal of Geographical Sciences, 28, 1127-1151(2018).
[25] et alSpatiotemporal change patterns of coastlines in Zhejiang Province, China, over the last twenty-five years. Sustainability, 10, 477(2018).
[26] et alEffects of long-term coastal reclamation on suitable habitat and wintering population size of the endangered red-crowned crane, Grus japonensis. Hydrobiologia, 827, 21-29(2019).
[27] et alResearch on dynamic changes of coastline in Shenzhen City based on Landsat image. Resources Science, 31, 875-883(2009).
[28] et alA comparative study on the changes of ecosystem services values in the bay basin between China and the USA: A case study on Xiangshangang Bay basin, Zhejiang and Tampa Bay basin, Florida. Geographical Research, 38, 357-368(2019).
[30] . Ecosystem and Human Well-being: Synthesis(2005).
[31] Recent coastal environmental management based on new concept of Satoumi which promotes land-ocean interaction: A case study in Japan. Estuarine Coastal and Shelf Science, 183, 179-186(2016).
[32] Influence of reclamation on the concentrations and chemical states of elements in tideland sediment. Journal of Radioanalytical and Nuclear Chemistry, 278, 495-498(2008).
[34] Integrating ecological damages into the user charge for land reclamation: A case study of Xiamen, China. Stochastic Environmental Research and Risk Assessment, 25, 341-351(2011).
[35] et alEcological damage appraisal of sea reclamation: Theory, method and application. Journal of Natural Resources, 20, 714-726(2005).
[36] . Coastal Remote Sensing Assessment(2015).
[37] et alDrivers, trends, and potential impacts of long-term coastal reclamation in China from 1985 to 2010. Estuarine, Coastal and Shelf Science, 170, 83-90(2016).
[38] et alLandscape grain effect in Yancheng coastal wetland and its response to landscape changes. International Journal of Environmental Research and Public Health, 16, 2225(2019).
[39] et alEcological vulnerability of the bay landscape and its response to human activities: A case study of the East China Sea. Acta Ecologica Sinica, 39, 342-353(2019).
[40] et alTidal and prism analysis of sea reclamation project in coastal bay. Water Resources, 42, 635-651(2015).
[41] Production and realization of marine ecosystem services. Acta Ecologica Sinica, 29, 2400-2406(2009).
[42] et alDevelopment and management of land reclamation in China. Ocean & Coastal Management, 102, 415-425(2014).
[44] et alImpact of coastal engineering constructions on the topographic and morphological evolution of Quanzhou Bay, Fujian, China. Ocean & Coastal Management, 54, 544-555(2011).
[45] Classification of bays in China. Oceanologia et Limnologia Sinica, 21, 185-191(1990).
[46] et alImprovement of the evaluation method for ecosystem service value based on per unit area. Journal of Natural Resources, 30, 1243-1254(2015).
[48] Effect of reclamation activity on coastal ecological environment: Progress and perspectives. Acta Ecologica Sinica, 38, 1148-1162(2018).

Set citation alerts for the article
Please enter your email address
© Copyright 2018-2021 | Chinese Laser Press. All Rights Reserved 沪ICP备15018463号-20