• Laser & Optoelectronics Progress
  • Vol. 59, Issue 7, 0706001 (2022)
Shuangshuang Wang, Yonglin Huang*, and Ping Zhan
Author Affiliations
  • College of Electronic and Optical Engineering & College of Microelectronics, Nanjing University of Posts and Telecommunications, Nanjing , Jiangsu 210023, China
  • show less
    DOI: 10.3788/LOP202259.0706001 Cite this Article Set citation alerts
    Shuangshuang Wang, Yonglin Huang, Ping Zhan. Surface Plasmon Resonance Sensor Based on Photonic Crystal Fiber in Regular Hexadecagon[J]. Laser & Optoelectronics Progress, 2022, 59(7): 0706001 Copy Citation Text show less
    Structure diagram of sensor
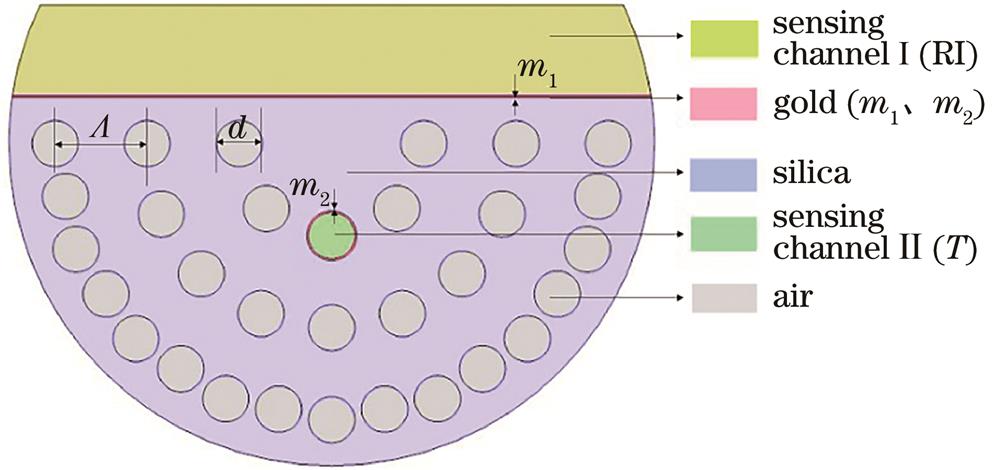
    Fig. 1. Structure diagram of sensor
    Simulation results of SPP mode and core mode. (a) SPP mode and (b) y-polarization core mode of sensing region Ⅰ; (c) zero-order, (d) first-order, (e) second-order, (f) third-order, and (g) fourth-order SPP module of sensing region Ⅱ; (h) zero-order y-polarization core mode; (i) first-order x-polarization core mode; (j) first-order y-polarization core mode; (k) second order x-polarization core mode; (l) second order y-polarization core mode
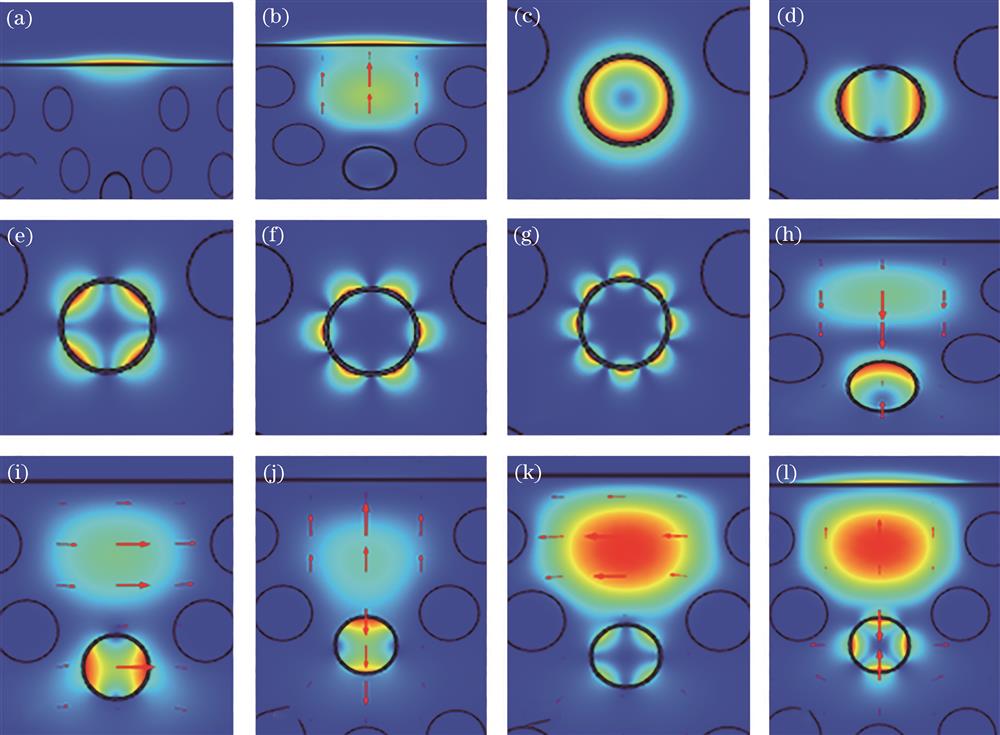
    Fig. 2. Simulation results of SPP mode and core mode. (a) SPP mode and (b) y-polarization core mode of sensing region Ⅰ; (c) zero-order, (d) first-order, (e) second-order, (f) third-order, and (g) fourth-order SPP module of sensing region Ⅱ; (h) zero-order y-polarization core mode; (i) first-order x-polarization core mode; (j) first-order y-polarization core mode; (k) second order x-polarization core mode; (l) second order y-polarization core mode
    RI of SPP modes and core modes, and confinement losses of x-polarization and y-polarization
    Fig. 3. RI of SPP modes and core modes, and confinement losses of x-polarization and y-polarization
    Plots of resonance peaks changing with RI and temperature
    Fig. 4. Plots of resonance peaks changing with RI and temperature
    Plots of resonance wavelength changing with RI. (a) 1.225—1.355; (b) 1.330—1.355
    Fig. 5. Plots of resonance wavelength changing with RI. (a) 1.225—1.355; (b) 1.330—1.355
    Variation of resonance wavelength with temperature. (a) 5—85 oC; (b) 20—60 oC
    Fig. 6. Variation of resonance wavelength with temperature. (a) 5—85 oC; (b) 20—60 oC
    Variation of confinement losses when m1 is in range of 30—60 nm
    Fig. 7. Variation of confinement losses when m1 is in range of 30—60 nm
    Variation of confinement losses when m2 is in range of 30—60 nm
    Fig. 8. Variation of confinement losses when m2 is in range of 30—60 nm
    m1RRIy-polarizationΔλ
    201.3355814
    1.34572
    301.3355814
    1.34572
    401.3359215
    1.34607
    Table 1. Resonance wavelength offset corresponding to different m1
    Shuangshuang Wang, Yonglin Huang, Ping Zhan. Surface Plasmon Resonance Sensor Based on Photonic Crystal Fiber in Regular Hexadecagon[J]. Laser & Optoelectronics Progress, 2022, 59(7): 0706001
    Download Citation