
Re Ziwanguli·yantake, Sun Lanlan, Wang Qingling, Ai Eken·sidike. Energy Transfer Mechanism of KAlSiO4∶Re 3+(Re=Dy/Sm) Phosphors[J]. Laser & Optoelectronics Progress, 2020, 57(21): 211601
- Laser & Optoelectronics Progress
- Vol. 57, Issue 21, 211601 (2020)
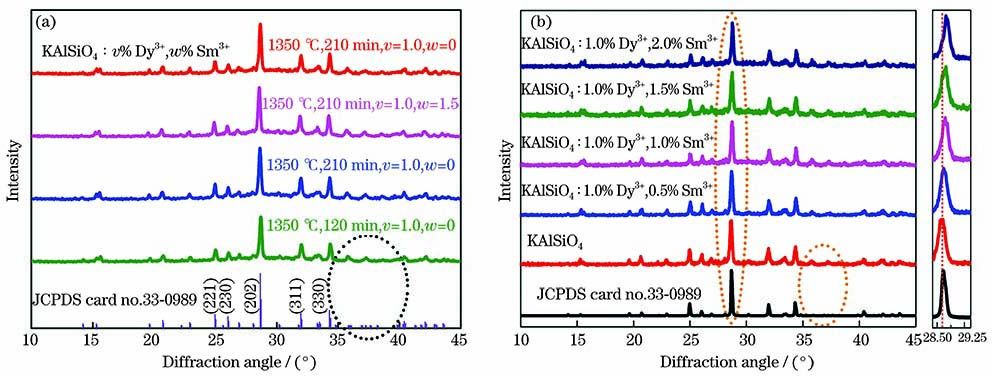
Fig. 1. XRD patterns of KAlSiO4∶Dy3+, Sm3+. (a) KAlSiO4∶v% Dy3+, w% Sm3+; (b) KAlSiO4∶1.0% Dy3+, w% Sm3+
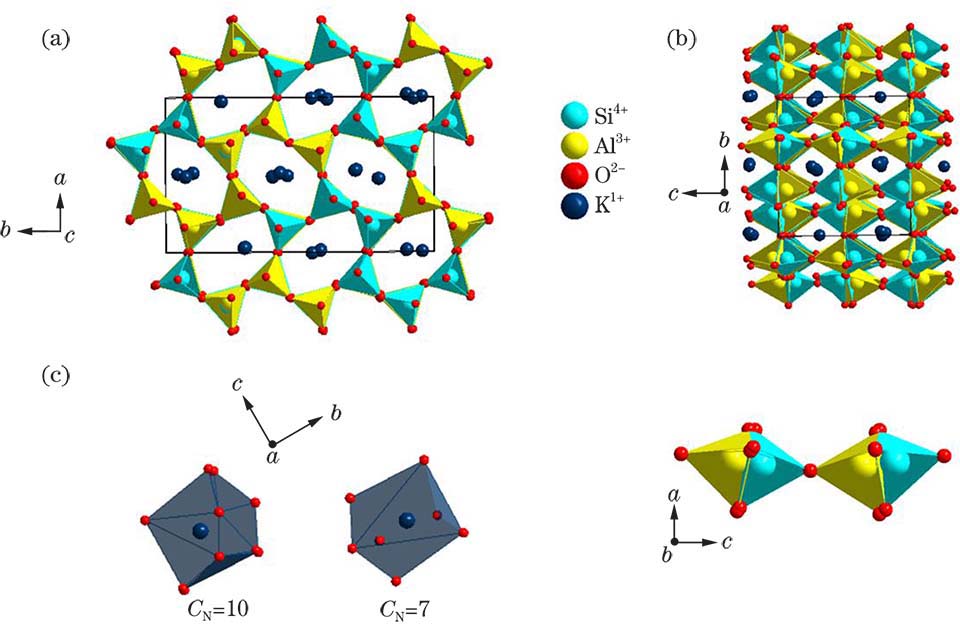
Fig. 2. Crystal structure of KAlSiO4. (a)(b) Crystal structures in different directions; (c) enlarged views of different polyhedra
Fig. 3. Excitation and emission spectra of samples. (a) KAlSiO4∶1.0% Dy3+ (illustration indicates relationship between emission intensity and mole fraction of Dy3+); (b) KAlSiO4∶1.5% Sm3+ (illustration indicates relationship between emission intensity and mole fraction of Sm3+)
Fig. 4. Excitation spectra of KAlSiO4∶1.0% Dy3+,w% Sm3+ phosphors
Fig. 5. Emission spectra and color coordinates of samples. (a) Emission spectra of KAlSiO4∶1.0% Dy3+, w% Sm3+ phosphors under 386 nm excitation; (b) color coordinates of KAlSiO4∶1.0% Dy3+, w% Sm3+ phosphors
Fig. 6. Emission spectra of samples and mechanism for energy transfer. (a) Emission spectra of KAlSiO4∶1.5% Sm3+,v% Dy3+ phosphors under 403 nm excitation; (b) mechanism for energy transfer between Dy3+ and Sm3+
Fig. 7. Lifetime decay curves of samples. (a) Dy3+ in KAlSiO4∶1.0% Dy3+, w% Sm3+ phosphors; (b) Sm3+ in KAlSiO4∶1.0% Dy3+, w% Sm3+ phosphors
Fig. 8. Relationship of Dy3+ lifetime and energy transfer efficiency with Sm3+ concentration
Fig. 9. Relationship between ISO/IS and Cn/3. (a) n=6; (b) n=8; (c) n=10

Set citation alerts for the article
Please enter your email address
© Copyright 2018-2021 | Chinese Laser Press. All Rights Reserved 沪ICP备15018463号-20