- Spectroscopy and Spectral Analysis
- Vol. 42, Issue 9, 2969 (2022)
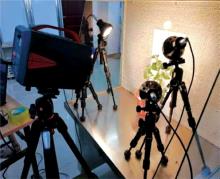
Fig. 1. Sample data collection
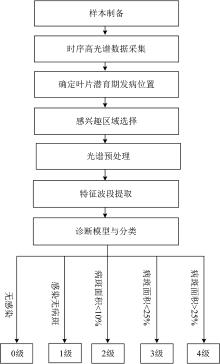
Fig. 2. Flowchart of tomato gray mold diagnosis and classification
Fig. 3. Hyperspectral images of inoculated pathogenic sample #1 in the first 8 days
Fig. 4. Hyperspectral mean reflectivity curves of tomato leaves in different periods
Fig. 5. Comparison of spectra with different pretreatment methods
Fig. 6. Feature wavebands extracted by DWT-CARS algorithm for three times
(a): The first extraction; (b): The second extraction; (c): The third extraction
(a): The first extraction; (b): The second extraction; (c): The third extraction
Fig. 7. Feature bands extracted by DWT-CARS algorithm for three times
(a): The first extraction; (b): The second extraction; (c): The third extraction
(a): The first extraction; (b): The second extraction; (c): The third extraction
Fig. 8. Confusion matrix of three model test sets
(a): DWT-FC-TLBO-ELM; (b): DWT-TLBO-ELM; (c): DWT-CARS-TLBO-ELM
(a): DWT-FC-TLBO-ELM; (b): DWT-TLBO-ELM; (c): DWT-CARS-TLBO-ELM
| ||||||||||||||||||||
Table 1. Feature bands extracted by DWT-CARS algorithm for three times
| ||||||||||||||||||||||||||||||
Table 2. Model parameters and test set accuracy, accuracy, recall rate and F 1 value

Download Citation

Set citation alerts for the article
Please enter your email address
© Copyright 2018-2021 | Chinese Laser Press. All Rights Reserved 沪ICP备15018463号-20