
Yiming Xiong, Feng Shao, Xiangchao Meng. Sparse Representation-Based Full-Reference Quality Assessment of Distorted Satellite Stereo Images[J]. Acta Optica Sinica, 2018, 38(12): 1210002
- Acta Optica Sinica
- Vol. 38, Issue 12, 1210002 (2018)
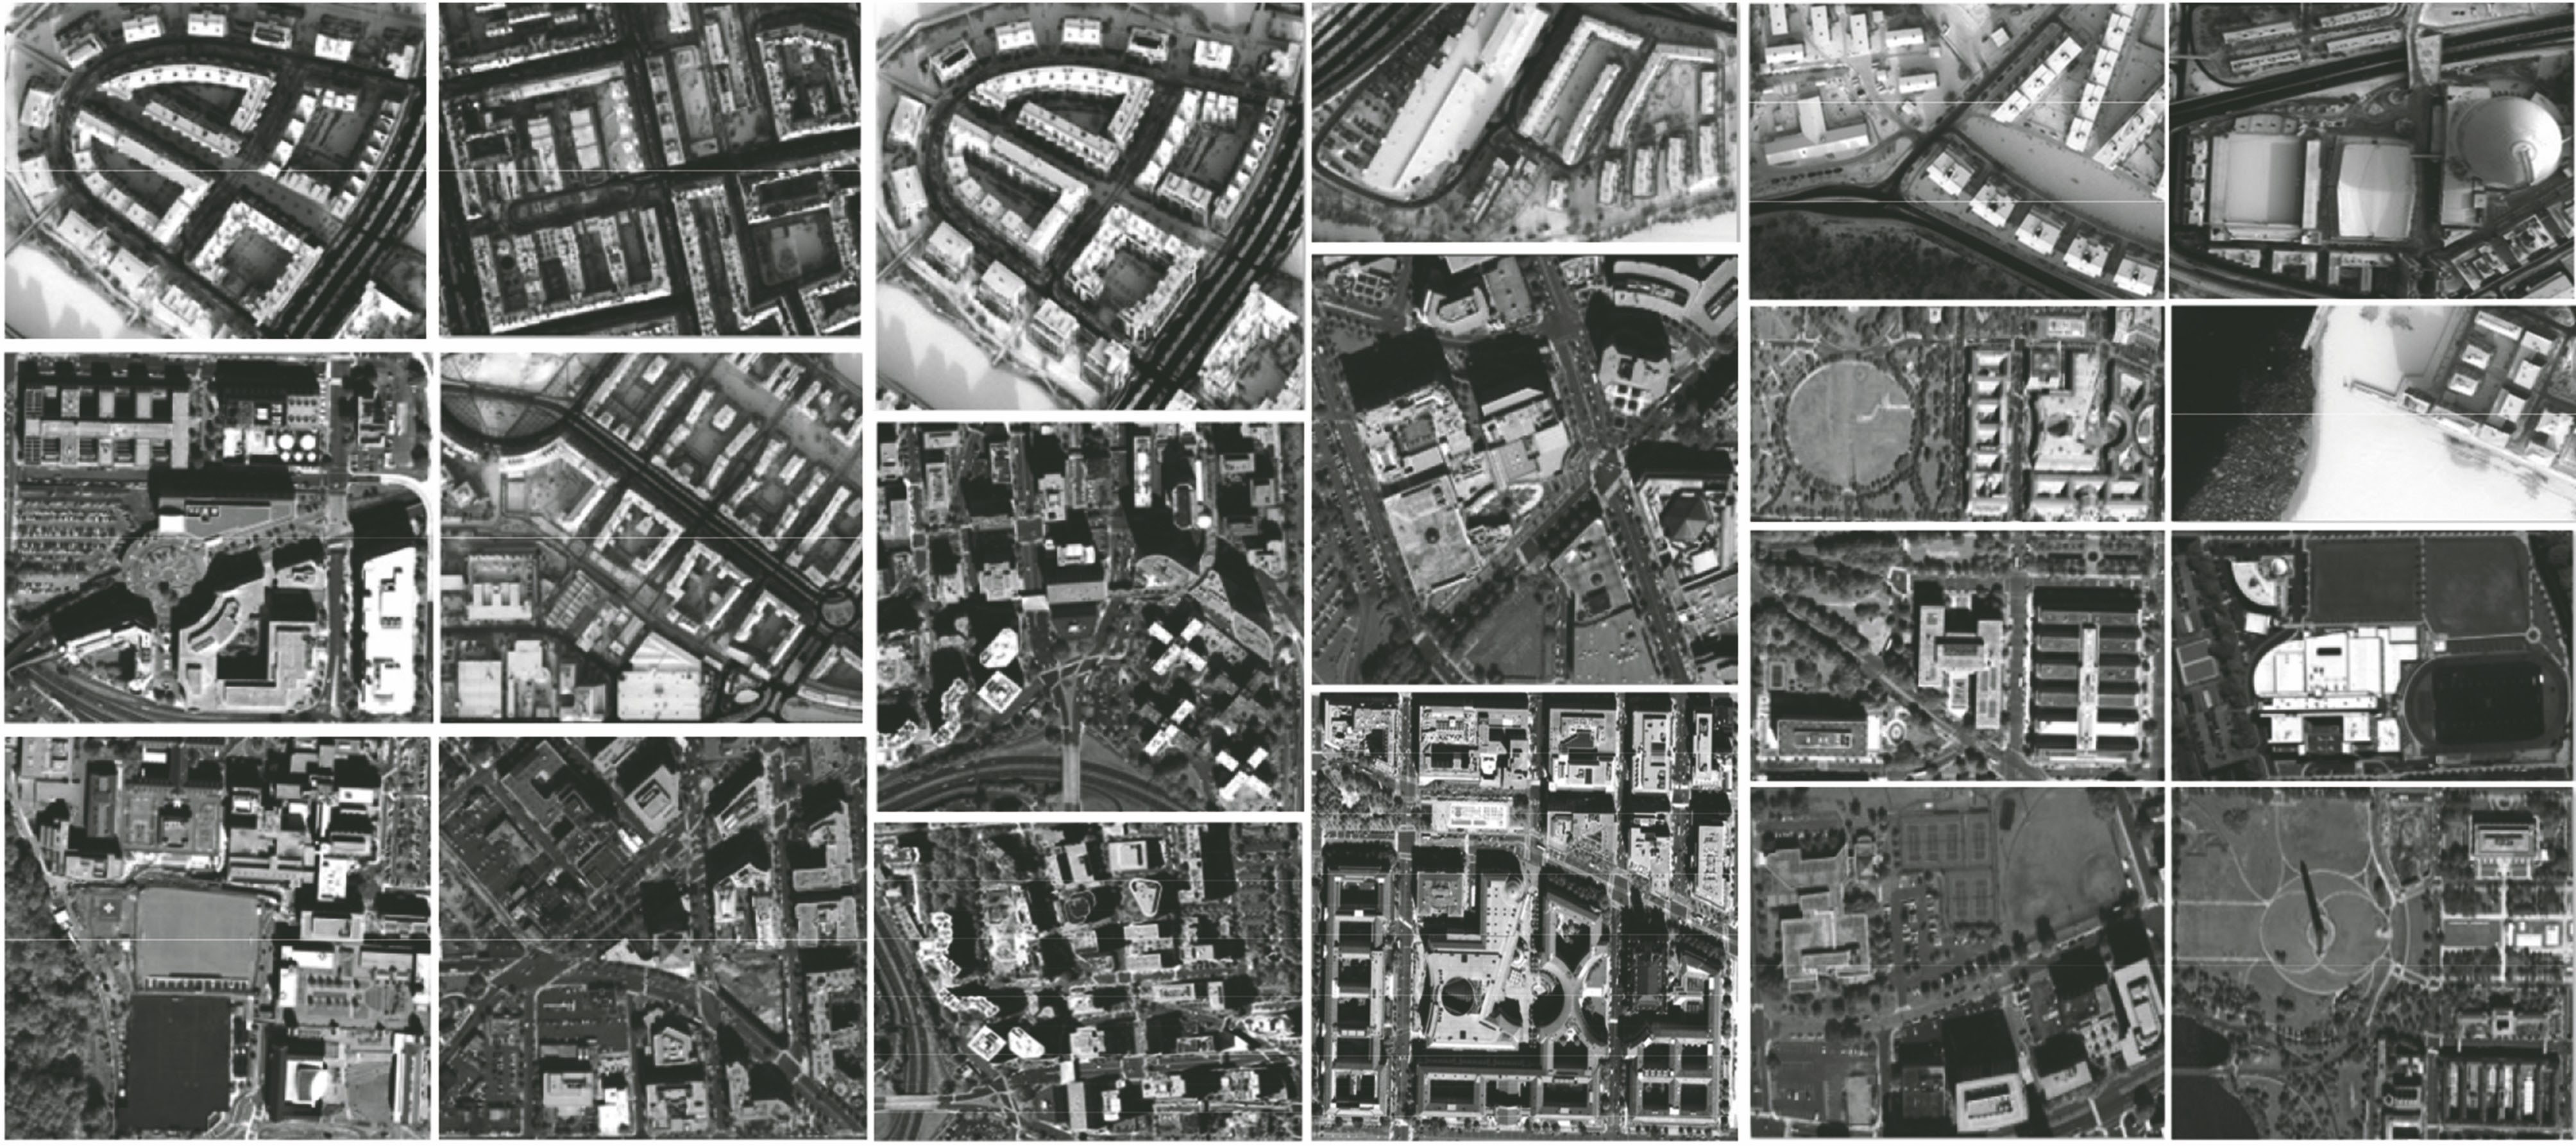
Fig. 1. Left images of the original satellite stereo images in the database
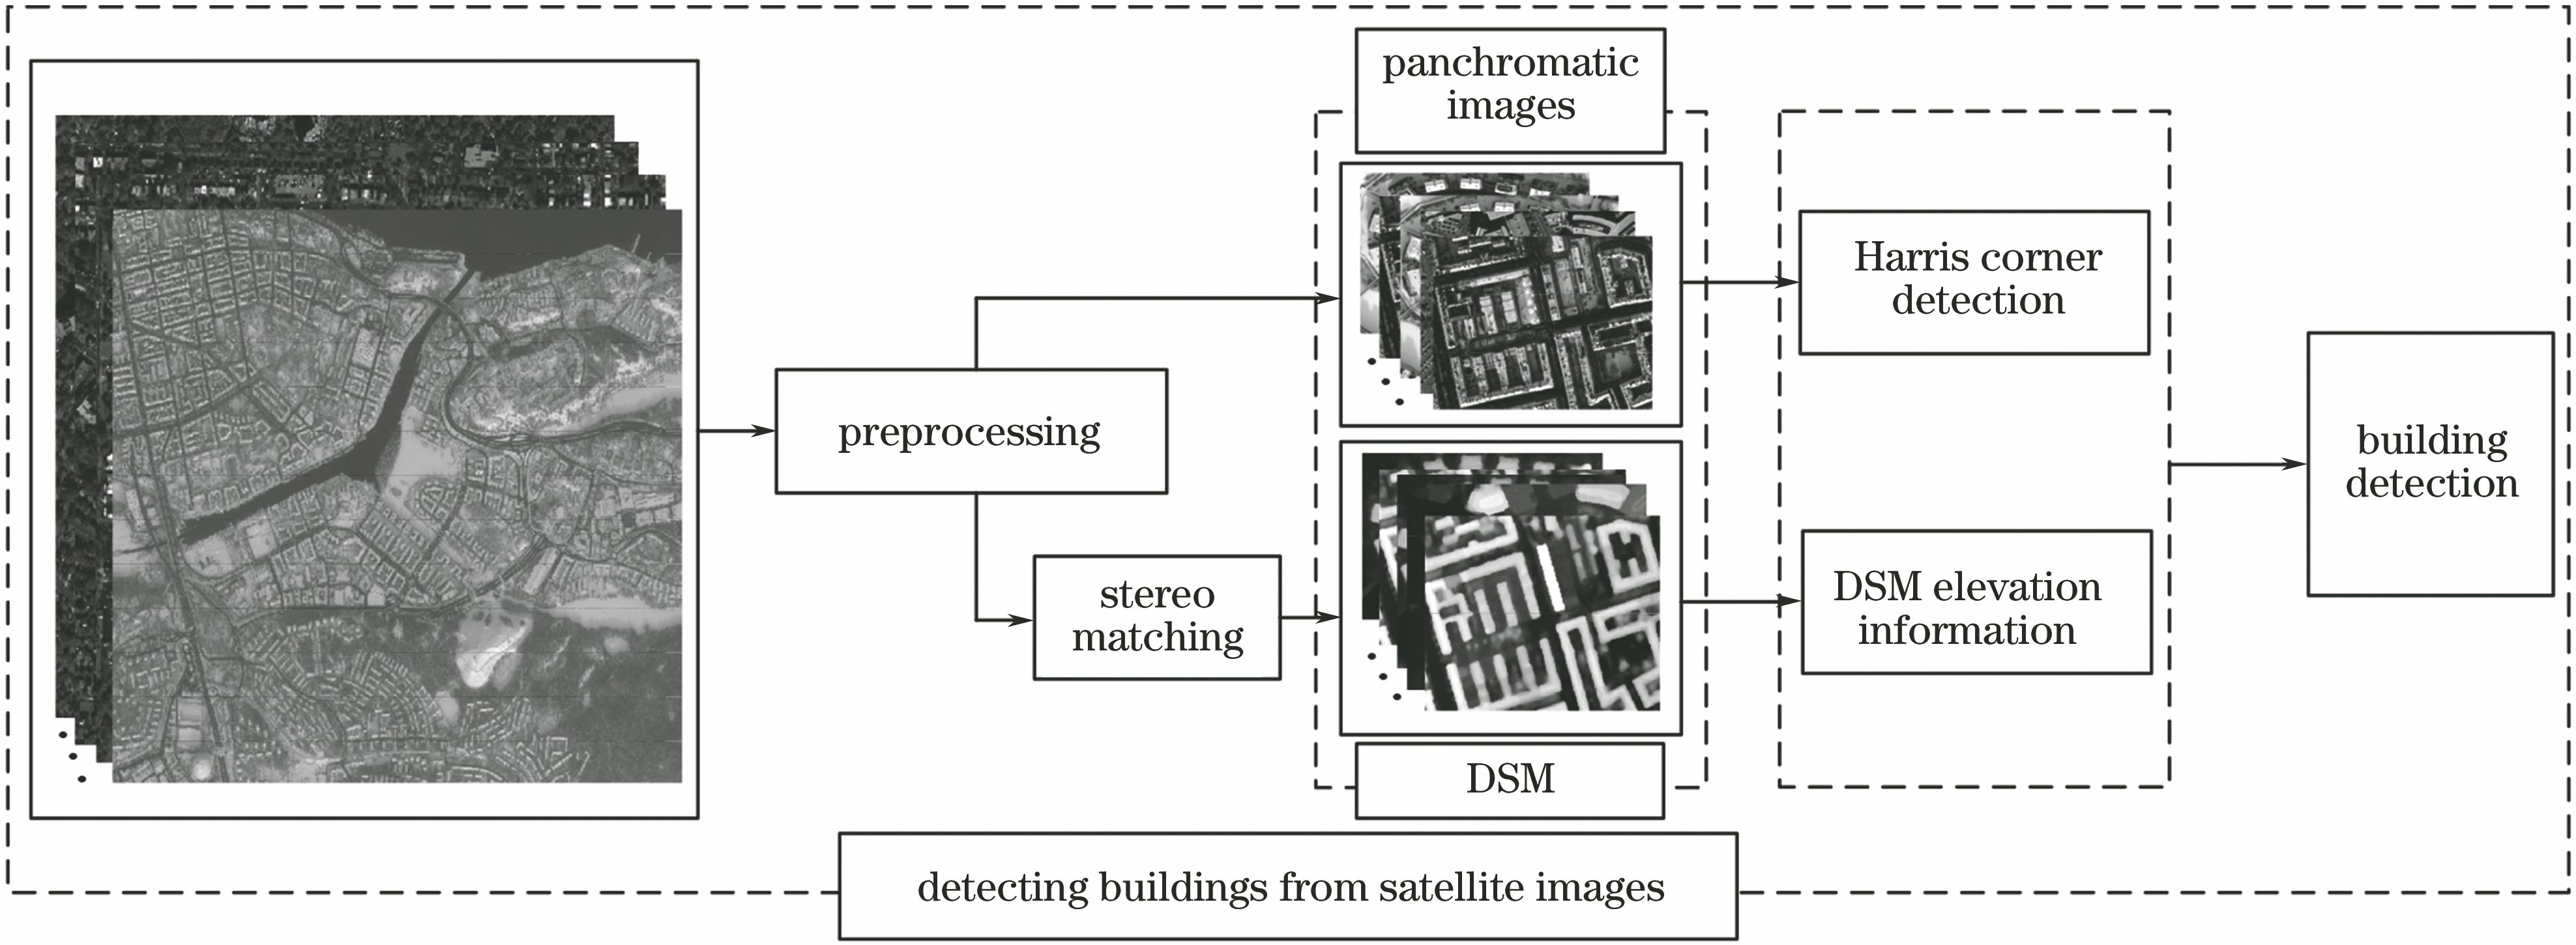
Fig. 2. Block diagram of building detection
Fig. 3. Original left image of building detection. (a) Corner detection results of original image; (b) DSM corresponding to Fig. (a); (c) building detection results
Fig. 4. Building detection in some areas. (a) Corner detection results; (b) DSM corresponding to Fig. (a); (c) building test results
Fig. 5. Building detection results. (a) Original image; (b) blur distortion image; (c) noise distortion image; (d) building detection of original image; (e) building detection result after blur distortion; (f) building detection result after noise distortion
Fig. 6. Building detection results. (a) Building detection results of original image; (b) building detection results after blur distortion; (c) building detection results after noise distortion
Fig. 7. Histogram of detection accuracy in the database
Fig. 8. Block diagram of objective quality evaluation. (a) Feature extraction; (b) sparse representation-based similarity measure
Fig. 9. SIFT features extraction. (a) SIFT features extraction of the original image; (b) SIFT features extraction of distorted image
Fig. 10. Scatter plots of evaluation prediction values and detection accuracy rates obtained by different evaluation methods. (a) MS-SSIM; (b) SSIM; (c) IFC; (d) VIF; (e) model in Ref.[27]; (f) FSIM; (g) GSM; (h) model in Ref.[29]; (i) proposed method
|
Table 1. Performance comparison of individual quality values
|
Table 2. Comparison of overall performance of different evaluation methods
| |||||||||||||||||||||||||||||||||||||||
Table 3. PLCC values of different distortion types
| |||||||||||||||||||||||||||||||||||||||
Table 4. SROCC values of different distortion types

Set citation alerts for the article
Please enter your email address
© Copyright 2018-2021 | Chinese Laser Press. All Rights Reserved 沪ICP备15018463号-20