• Acta Optica Sinica
  • Vol. 40, Issue 1, 0111025 (2020)
Qiong Wu1, Kun Gan1、*, Zhenzhou Zhang1, Zeyang Dou1, Weiping Liu2, and Jichuan Xiong2
Author Affiliations
  • 1Key Laboratory of Photoelectronic Imaging Technology and System, Ministry of Education, School of Optics and Photonics, Beijing Institute of Technology, Beijing 100081, China
  • 2School of Electronic and Optical Engineering, Nanjing University of Science and Technology, Nanjing, Jiangsu 210094, China
  • show less
    DOI: 10.3788/AOS202040.0111025 Cite this Article Set citation alerts
    Qiong Wu, Kun Gan, Zhenzhou Zhang, Zeyang Dou, Weiping Liu, Jichuan Xiong. Reconstruction of Variable Exponential Regularization for Wide-Field Polarization-Modulated Imaging[J]. Acta Optica Sinica, 2020, 40(1): 0111025 Copy Citation Text show less
    Experimental optical path of wide-field polarization-modulated imaging system
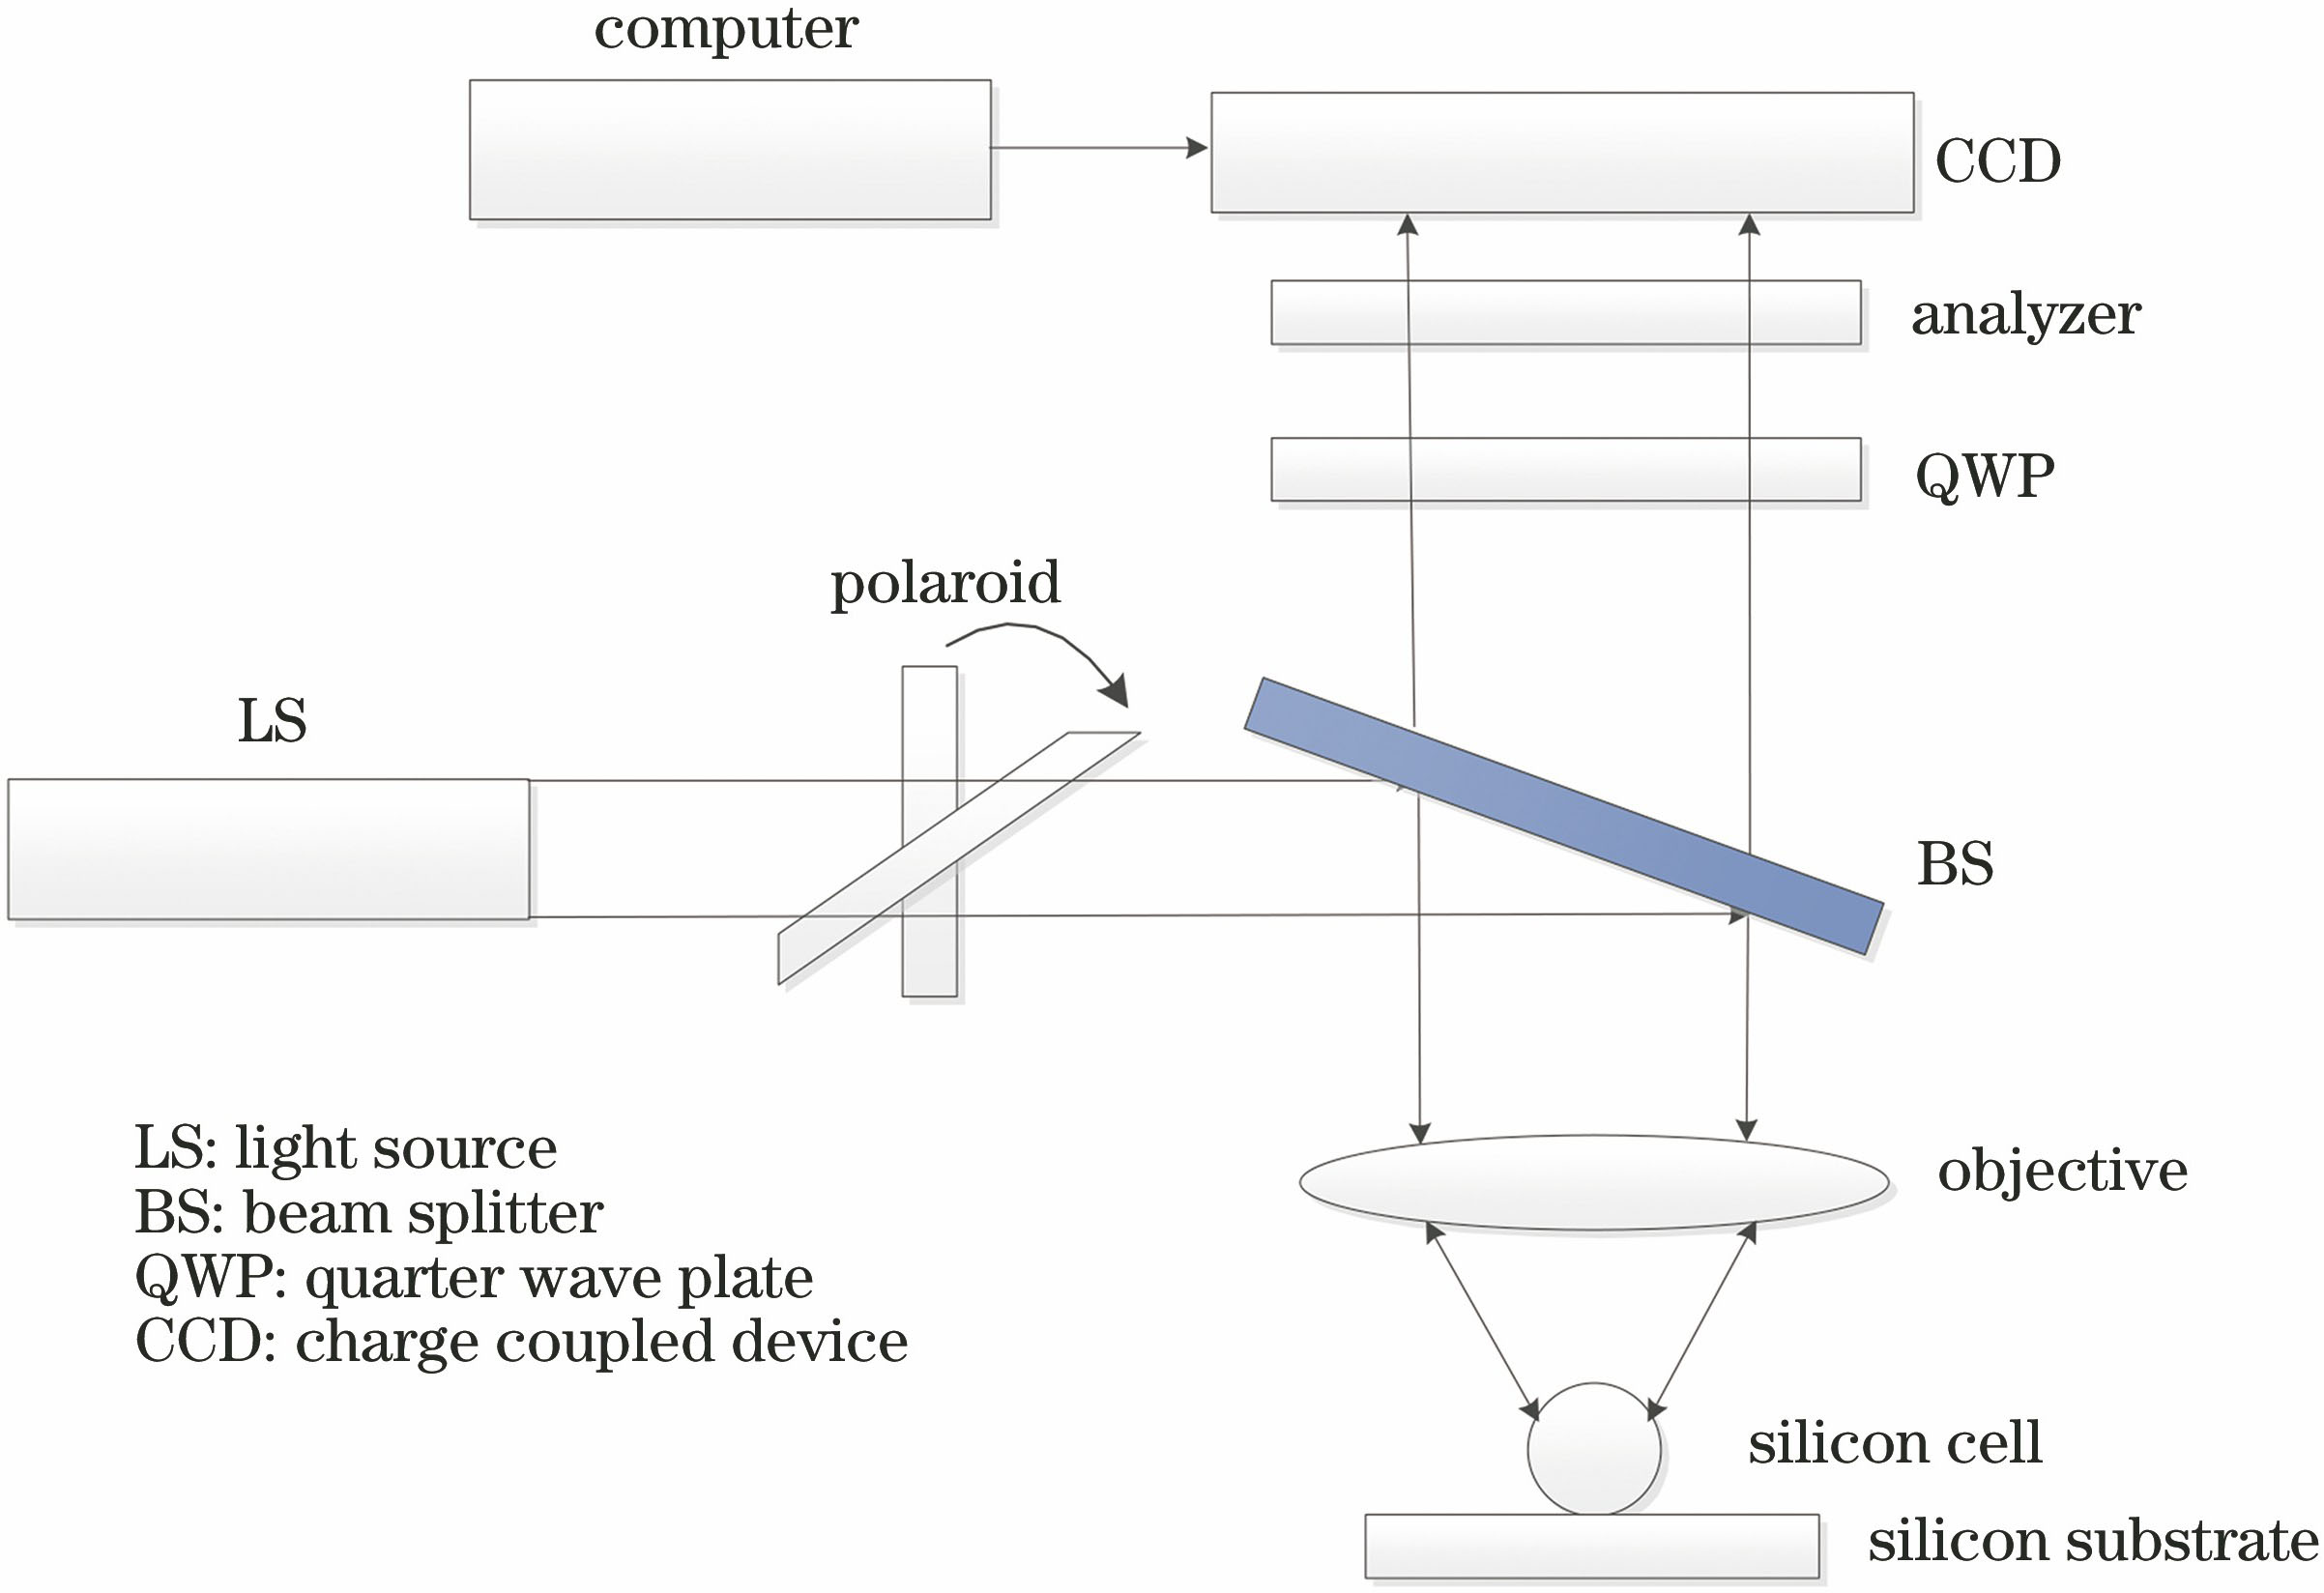
    Fig. 1. Experimental optical path of wide-field polarization-modulated imaging system
    Model of PSF obtained during polarization-modulated imaging stage
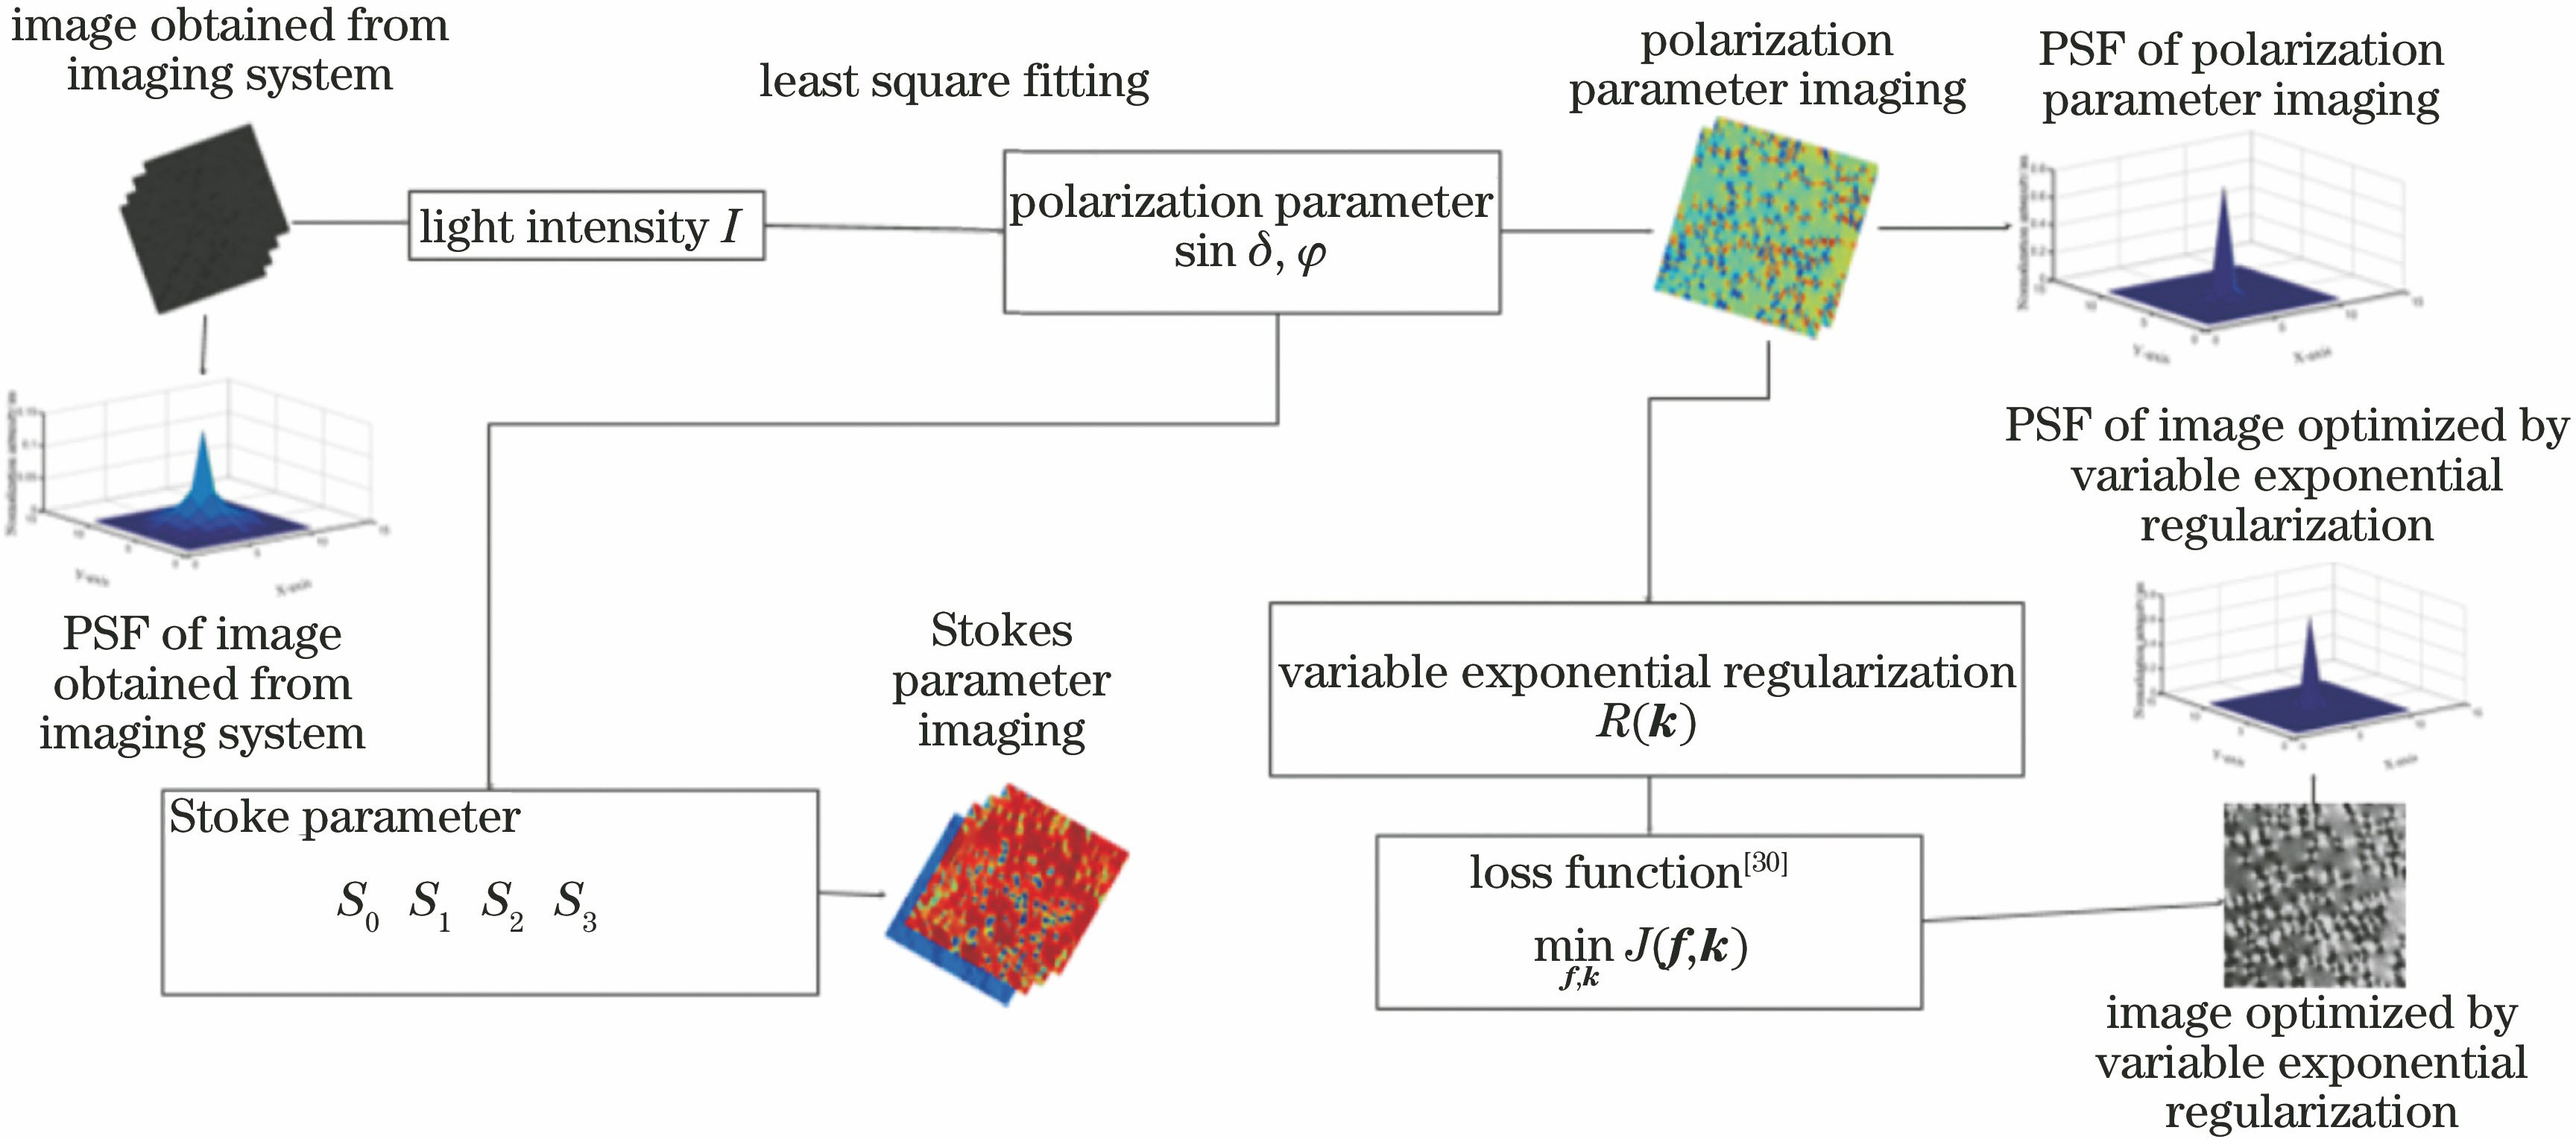
    Fig. 2. Model of PSF obtained during polarization-modulated imaging stage
    Dataset for experiments
    Fig. 3. Dataset for experiments
    Comparison of original and polarimetric images. (a) Original image; (b) sin δ image; (c) φ image
    Fig. 4. Comparison of original and polarimetric images. (a) Original image; (b) sin δ image; (c) φ image
    Comparison of original and polarimetric images. (a)(d) Original images; (b)(e) sin δ images; (c)(f) φ images
    Fig. 5. Comparison of original and polarimetric images. (a)(d) Original images; (b)(e) sin δ images; (c)(f) φ images
    Comparison of polarimetric and FDTD-simulated images. (a) sin δ image; (b) φ image; (c) simulated sin δ image; (d) simulated φ image
    Fig. 6. Comparison of polarimetric and FDTD-simulated images. (a) sin δ image; (b) φ image; (c) simulated sin δ image; (d) simulated φ image
    Light-intensity profiles of particle along tangent direction. (a) Original image; (b) polarimetric image; (c) light-intensity change of all pixel points in origin image; (d) light-intensity change of all pixel points in polarimetric image; (e) light-intensity change of particle pixel points in origin image; (f) light-intensity change of particle pixel points in polarimetric image
    Fig. 7. Light-intensity profiles of particle along tangent direction. (a) Original image; (b) polarimetric image; (c) light-intensity change of all pixel points in origin image; (d) light-intensity change of all pixel points in polarimetric image; (e) light-intensity change of particle pixel points in origin image; (f) light-intensity change of particle pixel points in polarimetric image
    Images of Stokes parameters. (a)--(d) Images of S0, S1, S2, and S3 parameters; (e)--(h) one particle extracted from images of S0, S1, S2, and S3 parameters at same place; (i)--(l) images of S0, S1, S2, and S3 parameters obtained from FDTD simulations
    Fig. 8. Images of Stokes parameters. (a)--(d) Images of S0, S1, S2, and S3 parameters; (e)--(h) one particle extracted from images of S0, S1, S2, and S3 parameters at same place; (i)--(l) images of S0, S1, S2, and S3 parameters obtained from FDTD simulations
    PSF models of polarization-modulated imaging results. (a)--(c) Non-optimized PSF models of original image of sample to be tested, sin δ image, and φ image; (d)--(f) optimized PSF models of original image, sin δ image, and φ image
    Fig. 9. PSF models of polarization-modulated imaging results. (a)--(c) Non-optimized PSF models of original image of sample to be tested, sin δ image, and φ image; (d)--(f) optimized PSF models of original image, sin δ image, and φ image
    Comparison of reconstruction effects of sin δ images by proposed method. (a)(d)(f) Original sin δ images; (b)(e)(g) optimized results by proposed method; (c) image difference between Fig. 10(a) and Fig. 10(b)
    Fig. 10. Comparison of reconstruction effects of sin δ images by proposed method. (a)(d)(f) Original sin δ images; (b)(e)(g) optimized results by proposed method; (c) image difference between Fig. 10(a) and Fig. 10(b)
    Comparison of reconstruction effects of φ images by proposed method. (a)(d)(f) Original φ images; (b)(e)(g) results of variable exponential optimization; (c) image difference between Fig. 11(a) and Fig. 11(b)
    Fig. 11. Comparison of reconstruction effects of φ images by proposed method. (a)(d)(f) Original φ images; (b)(e)(g) results of variable exponential optimization; (c) image difference between Fig. 11(a) and Fig. 11(b)
    Comparison of imaging effects among proposed method, TV regularization, and Tikhonov regularization
    Fig. 12. Comparison of imaging effects among proposed method, TV regularization, and Tikhonov regularization
    PSF models of polarization-modulated imaging results of polyethylene spheres. (a) PSF model of non-optimized sin δ image of sample to be tested; (b) PSF model of non-optimized φ image of sample to be tested; (c) PSF model of optimized sin δ image; (d) PSF model of optimized φ image
    Fig. 13. PSF models of polarization-modulated imaging results of polyethylene spheres. (a) PSF model of non-optimized sin δ image of sample to be tested; (b) PSF model of non-optimized φ image of sample to be tested; (c) PSF model of optimized sin δ image; (d) PSF model of optimized φ image
    Reconstruction effects of sin δ image by proposed method. (a)(c)(e) Original sin δ image; (b)(d)(f) optimized results by proposed method
    Fig. 14. Reconstruction effects of sin δ image by proposed method. (a)(c)(e) Original sin δ image; (b)(d)(f) optimized results by proposed method
    Reconstruction effects of φ image by proposed method. (a)(c)(e) Original φ images; (b)(d)(f) optimized results by proposed method
    Fig. 15. Reconstruction effects of φ image by proposed method. (a)(c)(e) Original φ images; (b)(d)(f) optimized results by proposed method
    Comparison of imaging effects among proposed method, TV regularization, and Tikhonov regularization
    Fig. 16. Comparison of imaging effects among proposed method, TV regularization, and Tikhonov regularization
    ImageMethodMeanVarianceMSEPSNRMSSIMEntropy
    Raw123.55453.8---7.5
    sin δOurs123.55453.82327.114.50.157.7
    TV126.34761.7537.720.80.177.8
    Tikhonov134.92707.61667.815.90.127.7
    Raw140.85408.0---7.5
    φOurs140.85408.02385.614.40.307.8
    TV141.54687.2560.920.60.177.8
    Tikhonov140.62750.41647.816.10.137.6
    Table 1. Objectiveevaluation indexes of sin δ and φ images optimized by three methods
    ImageMethodMeanVarianceMSEPSNRMSSIMEntropy
    Raw235.91234.6---6.6
    sin δOurs235.71147.0540.920.80.295.5
    TV229.31167.5161.626.00.265.9
    Tikhonov188.7772.32610.314.00.286.5
    Raw47.91980.1---7.1
    φOurs48.31996.4684.019.80.276.9
    TV54.41893.0142.426.60.307.0
    Tikhonov103.6867.23682.312.50.336.9
    Table 2. Objectiveevaluation indexes of sin δ and φ images optimized by three methods
    Qiong Wu, Kun Gan, Zhenzhou Zhang, Zeyang Dou, Weiping Liu, Jichuan Xiong. Reconstruction of Variable Exponential Regularization for Wide-Field Polarization-Modulated Imaging[J]. Acta Optica Sinica, 2020, 40(1): 0111025
    Download Citation