Author Affiliations
1Institute of Logistic Science and Technology, Academy of System Engineering, Academy of Military Sciences, Beijing 100071, China2School of Geospatial Information, SSF Information Engineering University, Zhengzhou, Henan 450001, China3Beijing Institute of Tracking and Telecommunications Technology, Beijing 100094, Chinashow less
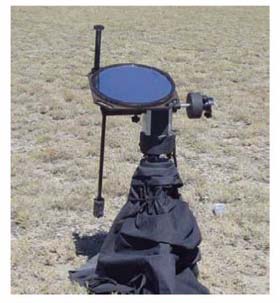
Fig. 1. Reflective point source
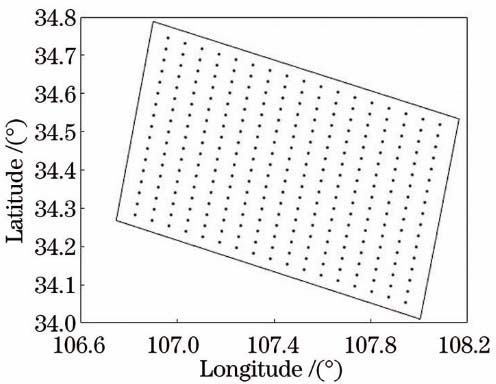
Fig. 2. Plane distribution of analog control points
Fig. 3. Point source image data. (a) Image of 1000 pixel × 1000 pixel; (b) enlarged point source images corresponding to 4 control points
Fig. 4. Error between calculated and actual value of center position of each point source image
| Image | RX /pixel | RY /pixel | RMX /pixel | RMY /pixel |
|---|
| Front view image | 0.01 | 0.01 | 0.03 | 0.04 | | Rear view image | 0.01 | 0.01 | 0.03 | 0.03 |
|
Table 1. Root-mean-square error and maximum error between calculated and actual value of center position of point source
| Target type | Coordinate error of image point /m | RXY /m | RZ /m | RMXY /m | RMZ /m |
|---|
| Point source target | 0.01 | 0.14 | 0.10 | 0.38 | 0.35 | | Traditional target | 0.33 | 3.75 | 2.46 | 9.82 | 5.78 | | Traditional target | 1 | 10.07 | 3.36 | 26.77 | 8.09 |
|
Table 2. Single image positioning and stereo positioning errors of front and rear view images under different image point errors
| Coordinate errors ofimage point | ω0 /rad | ω1 /rad | φ0 /rad | φ1 /rad | κ0 /rad | κ1 /rad |
|---|
| 1 pixel | -4.4814×10⁻⁵ | 5.0200×10⁻¹¹ | 5.7318×10⁻⁵ | 7.3143×10⁻¹¹ | 1.8368×10⁻⁴ | -2.6546×10⁻¹¹ | | 0.33 pixel | -4.4819×10⁻⁵ | 7.2451×10⁻¹² | 5.5107×10⁻⁵ | 2.6148×10⁻¹¹ | 1.7851×10⁻⁴ | -7.9764×10⁻¹² | | 0.01 pixel | -4.4819×10⁻⁵ | 1.4032×10⁻¹² | 5.5941×10⁻⁵ | 1.5816×10⁻¹² | 1.8125×10⁻⁴ | -6.9553×10⁻¹² | | True value | -4.4811×10⁻⁵ | 8.3272×10⁻¹³ | 5.5929×10⁻⁵ | 8.0215×10⁻¹³ | 1.8123×10⁻⁴ | -3.1229×10⁻¹³ |
|
Table 3. Calculated values of external calibration parameters under different image point errors
| Coordinateerror of imagepoint | Δxp /mm | Δyp /mm | k1 | k2 | P1 | P2 | S | R |
|---|
| 1 pixel | 1.780×10⁻⁵ | 1.18×10⁻⁴ | -5.76×10⁻⁵ | -1.99×10⁻⁷ | 1.30×10⁻⁴ | 2.90×10⁻⁴ | 2.18×10⁻⁴ | -9.49×10⁻⁵ | | 0.33 pixel | 6.486×10⁻⁶ | 7.40×10⁻⁵ | -6.05×10⁻⁵ | -1.86×10⁻⁷ | 4.75×10⁻⁵ | 1.79×10⁻⁴ | 1.11×10⁻⁴ | 3.46×10⁻⁵ | | 0.01 pixel | 2.661×10⁻⁸ | 6.95×10⁻⁶ | -3.32×10⁻⁶ | -4.45×10⁻⁹ | 1.92×10⁻⁷ | 1.70×10⁻⁵ | -2.7×10⁻⁵ | -1.25×10⁻⁷ | | True value | 3.556×10⁻⁸ | 6.94×10⁻⁶ | -3.34×10⁻⁶ | -4.51×10⁻⁹ | 2.58×10⁻⁷ | 1.70×10⁻⁵ | -2.72×10⁻⁵ | -1.65×10⁻⁷ |
|
Table 4. Calculated values of internal calibration parameters under different image point errors
| Coordinate error ofimage point /pixel | Control point | Check point |
|---|
| RXY /m | RZ /m | RMXY /m | RMZ /m | RXY /m | RZ /m | RMXY /m | RMZ /m |
|---|
| 0.01 | 0.14 | 0.11 | 0.40 | 0.35 | 0.03 | 0.01 | 0.04 | 0.02 | | 0.33 | 3.53 | 2.38 | 10.27 | 5.68 | 0.47 | 0.22 | 0.85 | 0.60 | | 1 | 9.36 | 3.32 | 28.07 | 7.82 | 1.43 | 0.25 | 2.25 | 0.67 |
|
Table 5. Positioning errors of control points and check points under different image point errors
Point
distribution | Error of 0.01 pixel | Error of 0.33 pixel | Error of 1 pixel |
|---|
| RXY /m | RZ /m | RMXY /m | RMZ /m | RXY /m | RZ /m | RMXY /m | RMZ /m | RXY /m | RZ /m | RMXY /m | RMZ /m |
|---|
 | 27.8 | 40.4 | 33.8 | 49.5 | 27.8 | 40.4 | 33.8 | 49.5 | 27.8 | 40.4 | 33.8 | 49.5 |  | 3.81 | 5.54 | 6.33 | 9.11 | 4.79 | 6.98 | 9.09 | 13.3 | 5.3 | 7.2 | 9.4 | 13.7 |  | 0.14 | 0.04 | 0.22 | 0.08 | 3.17 | 1.69 | 5.72 | 3.21 | 9.93 | 1.05 | 18.37 | 1.79 |  | 0.12 | 0.04 | 0.19 | 0.08 | 3.08 | 1.42 | 5.65 | 2.20 | 9.70 | 2.29 | 17.80 | 3.03 |  | 0.09 | 0.04 | 0.12 | 0.06 | 1.98 | 0.76 | 3.95 | 1.29 | 6.17 | 2.62 | 11.87 | 3.73 |  | 0.07 | 0.03 | 0.10 | 0.04 | 2.10 | 1.38 | 3.99 | 2.04 | 6.39 | 3.14 | 11.94 | 4.06 |  | 0.08 | 0.05 | 0.10 | 0.07 | 2.38 | 1.39 | 3.88 | 1.93 | 7.35 | 2.60 | 12.03 | 3.09 |  | 0.05 | 0.02 | 0.08 | 0.04 | 1.35 | 0.41 | 2.48 | 1.04 | 4.02 | 0.71 | 7.18 | 1.37 |
|
Table 6. Positioning errors of check points under different image point errors and control point distributions
Point
distribution | Error of 0.01 pixel | Error of 0.33 pixel | Error of 1 pixel |
|---|
| RXY /m | RZ /m | RMXY /m | RMZ /m | RXY /m | RZ /m | RMXY /m | RMZ /m | RXY /m | RZ /m | RMXY /m | RMZ /m |
|---|
 | 0.05 | 0.01 | 0.07 | 0.03 | 1.33 | 0.81 | 2.68 | 1.22 | 4.04 | 1.69 | 8.02 | 2.42 |
|
Table 7. Positioning errors of check points when 4 new control points added to 9-point layout plan using precise image point coordinates