• Laser & Optoelectronics Progress
  • Vol. 58, Issue 13, 1306010 (2021)
Liang Wang, Hao Wu*, Ming Tang**, and Deming Liu
Author Affiliations
  • Wuhan National Lab for Optoelectronics (WNLO) & National Engineering Laboratory for Next Generation Internet Access System, School of Optics and Electronic Information, Huazhong University of Science and Technology, Wuhan , Hubei 430074, China
  • show less
    DOI: 10.3788/LOP202158.1306010 Cite this Article Set citation alerts
    Liang Wang, Hao Wu, Ming Tang, Deming Liu. Research Status of Brillouin Signal Analysis Method Based on Machine Learning[J]. Laser & Optoelectronics Progress, 2021, 58(13): 1306010 Copy Citation Text show less
    Change curves of BGS and LCF
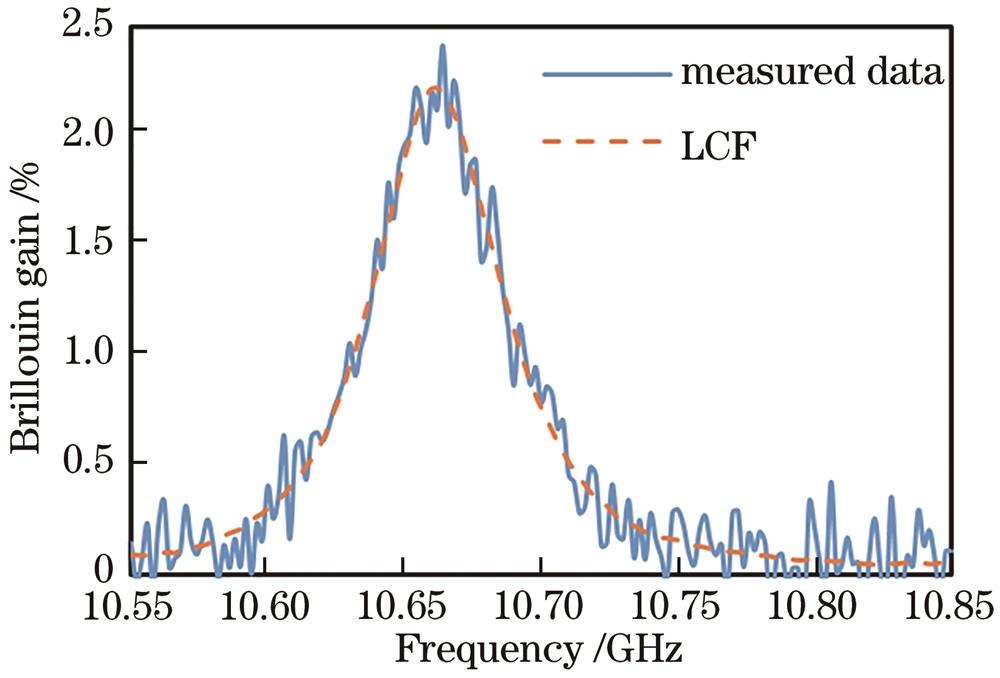
    Fig. 1. Change curves of BGS and LCF
    Schematic of ANN[30]
    Fig. 2. Schematic of ANN[30]
    Fiber temperature distribution diagram extracted by ANN under different frequency sweep intervals, where temperature of fiber at 41 m of tail is (a) 21.00 ℃ (room temperature), (b) 29.90 ℃, (c) 39.14 ℃, and (d) 48.63 ℃[30]
    Fig. 3. Fiber temperature distribution diagram extracted by ANN under different frequency sweep intervals, where temperature of fiber at 41 m of tail is (a) 21.00 ℃ (room temperature), (b) 29.90 ℃, (c) 39.14 ℃, and (d) 48.63 ℃[30]
    Ratio of time spent in processing BGS data between LCF and ANN[30]
    Fig. 4. Ratio of time spent in processing BGS data between LCF and ANN[30]
    Schematic of SVM extraction temperature[32]
    Fig. 5. Schematic of SVM extraction temperature[32]
    Measured BGS distribution and temperature distribution extracted by SVM-0.5 °C[32]
    Fig. 6. Measured BGS distribution and temperature distribution extracted by SVM-0.5 °C[32]
    Uncertainty and RMSE comparison curves under different SNR[32]. (a1) (a2) 11.5 dB; (b1) (b2) 6.1 dB
    Fig. 7. Uncertainty and RMSE comparison curves under different SNR[32]. (a1) (a2) 11.5 dB; (b1) (b2) 6.1 dB
    Structure and extraction principle of DNN[35]. (a) DNN structure; (b) schematic of extracting temperature and stress at the same time by DNN
    Fig. 8. Structure and extraction principle of DNN[35]. (a) DNN structure; (b) schematic of extracting temperature and stress at the same time by DNN
    Experimental device of LEAF and comparison curves of extraction results of different methods[35]. (a) Experimental device; (b) comparison curves of temperature and stress under DNN and equation solving method
    Fig. 9. Experimental device of LEAF and comparison curves of extraction results of different methods[35]. (a) Experimental device; (b) comparison curves of temperature and stress under DNN and equation solving method
    BGS signal processing flow based on K-SVD algorithm [37]
    Fig. 10. BGS signal processing flow based on K-SVD algorithm [37]
    Temperature error curves of K-SVD algorithm and LCF algorithm[37]
    Fig. 11. Temperature error curves of K-SVD algorithm and LCF algorithm[37]
    ELM training and testing process[38]
    Fig. 12. ELM training and testing process[38]
    CNN structure for extracting BFS [40]
    Fig. 13. CNN structure for extracting BFS [40]
    Comparison of BFS results after CNN and LCF algorithm processing[40]
    Fig. 14. Comparison of BFS results after CNN and LCF algorithm processing[40]
    Frequency step /MHzSVM-0.5 ℃/sLCF /minpVCF /min
    TrainingTest
    11.17815.7532.7036.12
    20.91611.1423.1925.62
    50.56811.0622.5024.75
    100.45111.3222.1924.40
    150.33512.5521.8924.08
    Table 1. Time comparison of different methods for processing 1×10⁵ BGS[32]
    Liang Wang, Hao Wu, Ming Tang, Deming Liu. Research Status of Brillouin Signal Analysis Method Based on Machine Learning[J]. Laser & Optoelectronics Progress, 2021, 58(13): 1306010
    Download Citation