
Jia-Hao Bai, Jian-Gang Guo. Theoretical studies on bidirectional interfacial shear stress transfer of graphene/flexible substrate composite structure [J]. Acta Physica Sinica, 2020, 69(5): 056201-1
- Acta Physica Sinica
- Vol. 69, Issue 5, 056201-1 (2020)
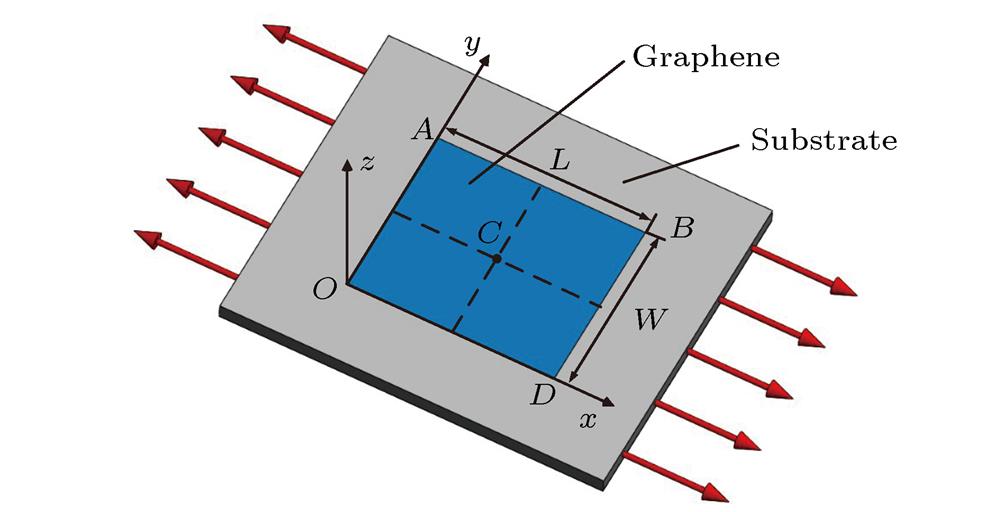
Fig. 1. Schematic diagram of the graphene/substrate structure under uniaxial tension.
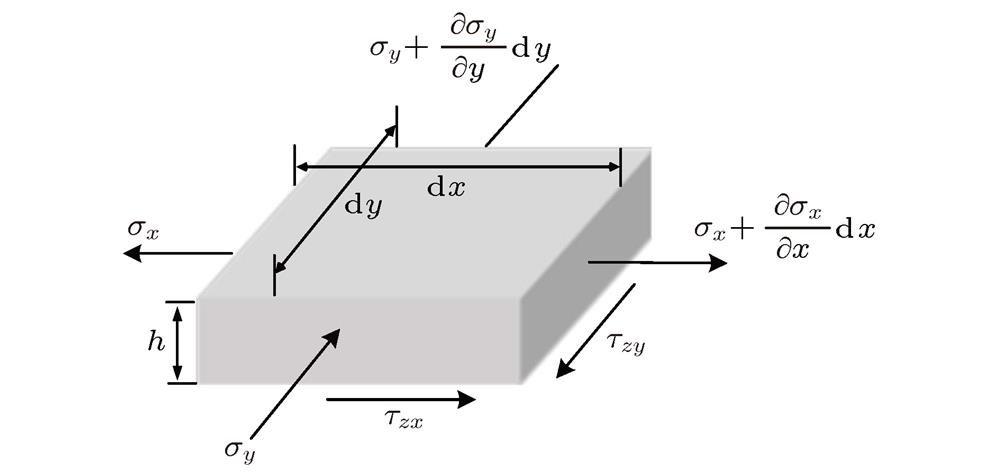
Fig. 2. The force balance of an element of graphene.
Fig. 3. Analysis of interfacial shear stresses at local interface.
Fig. 4. (a) Two-dimensional nonlinear shear-lag model; (b) bilinear cohesive shear-mode (Ⅱ + Ⅲ) law.
Fig. 5. Distributions of graphene’s normal strains (a) εx and (b) εy ; distributions of interfacial shear stresses (c) τzx and (d) τzy at the elastic bonding stage (ε sx = 0.2%).
Fig. 6. Distributions of graphene’s strains (a) εx and (b) εy ; distributions of interfacial shear stresses (c) τzx and (d) τzy along several representative lines.
Fig. 7. Variation of the critical strain for sliding with the width of graphene at different Poisson's ratio of substrate (the lines are the theoretical results, and the scatter points are the FEM results).
Fig. 8. Schematic diagram of interfacial sliding stage.
Fig. 9. Distributions of graphene’s normal strains (a) εx and (b) εy ; distributions of interfacial shear stresses (c) τzx and (d) τzy at the interfacial sliding stage (ε sx = 1%).
Fig. 10. Variation of compressive strain εyC at the center point C of graphene with its width when the strain of substrate is different.
Fig. 11. Comparisons of the results obtained via one-dimensional and two-dimensional models (W = 21.8 μm): (a) εx and (b) τzx at the elastic bonding stage (ε sx = 0.2%); (c) εx and (d) τzx at the interfacial sliding stage (ε sx = 1%).
Fig. 12. Comparisons of the results obtained via one-dimensional and two-dimensional models (W = 1 μm): (a) εx and (b) τzx at the interfacial sliding stage (ε sx = 1%).
Fig. 13. Fitting results of experimental data by using 2D model: (a) ε m along the centerline (y = W /2) when the tensile strain ε sx = 0.25%; (b)
 at the center point
 C under different tensile loads.
at the center point 
Set citation alerts for the article
Please enter your email address
© Copyright 2018-2021 | Chinese Laser Press. All Rights Reserved 沪ICP备15018463号-20