• Photonics Research
  • Vol. 5, Issue 3, 151 (2017)
Grzegorz Soboń1、*, Tadeusz Martynkien2, Karol Tarnowski2, Paweł Mergo3, and Jarosław Sotor1
Author Affiliations
  • 1Laser & Fiber Electronics Group, Faculty of Electronics, Wrocław University of Science and Technology, Wybrzeze Wyspianskiego 27, 50-370 Wroclaw, Poland
  • 2Department of Optics and Photonics, Faculty of Fundamental Problems of Technology, Wroclaw University of Science and Technology, Wybrzeze Wyspianskiego 27, 50-370 Wroclaw, Poland
  • 3Laboratory of Optical Fiber Technology, Maria Curie-Sklodowska University, pl. M. Curie-Sklodowskiej 3, Lublin, Poland
  • show less
    DOI: 10.1364/PRJ.5.000151 Cite this Article Set citation alerts
    Grzegorz Soboń, Tadeusz Martynkien, Karol Tarnowski, Paweł Mergo, Jarosław Sotor. Generation of sub-100  fs pulses tunable from 1700 to 2100  nm from a compact frequency-shifted Er-fiber laser[J]. Photonics Research, 2017, 5(3): 151 Copy Citation Text show less
    Experimental setup of the all-fiber frequency-shifted laser. EDF: Erbium-doped fiber; GSA: graphene saturable absorber; WDM: wavelength division multiplexer; OC/ISO/WDM—output coupler/isolator/WDM hybrid component.
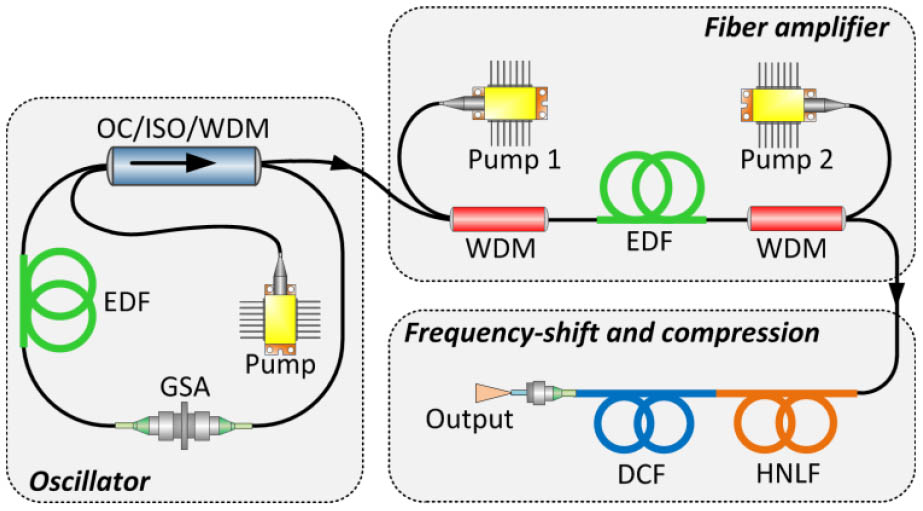
    Fig. 1. Experimental setup of the all-fiber frequency-shifted laser. EDF: Erbium-doped fiber; GSA: graphene saturable absorber; WDM: wavelength division multiplexer; OC/ISO/WDM—output coupler/isolator/WDM hybrid component.
    SEM images of the fabricated HNLF.
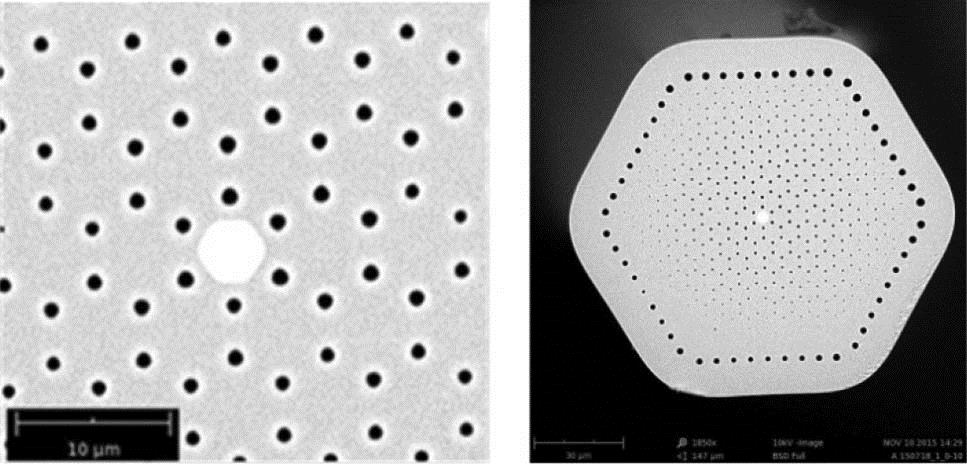
    Fig. 2. SEM images of the fabricated HNLF.
    Measured dispersion characteristics of the HNLF and DCF fibers (dotted lines). Blue solid line represents the HNLF dispersion curve calculated based on the actual geometry of the fiber. Red solid line is the polynomial fitting of the measured DCF-2000 dispersion curve.
    Fig. 3. Measured dispersion characteristics of the HNLF and DCF fibers (dotted lines). Blue solid line represents the HNLF dispersion curve calculated based on the actual geometry of the fiber. Red solid line is the polynomial fitting of the measured DCF-2000 dispersion curve.
    Measured (blue line) and calculated (red dots) optical spectra at the DCF output for different pumping powers. Spectra between 1800–1920 nm are affected by water absorption lines.
    Fig. 4. Measured (blue line) and calculated (red dots) optical spectra at the DCF output for different pumping powers. Spectra between 1800–1920 nm are affected by water absorption lines.
    Average output power of the frequency-shifted soliton (filtered from the entire spectrum) at different central wavelengths.
    Fig. 5. Average output power of the frequency-shifted soliton (filtered from the entire spectrum) at different central wavelengths.
    Measured pulse autocorrelations of the frequency-shifted solitons at different central wavelengths from 1700 to 2100 nm.
    Fig. 6. Measured pulse autocorrelations of the frequency-shifted solitons at different central wavelengths from 1700 to 2100 nm.
    Comparison between the (a) optical spectrum and (b) pulse duration of the soliton centered at 2050 nm before and after the DCF-2000 fiber.
    Fig. 7. Comparison between the (a) optical spectrum and (b) pulse duration of the soliton centered at 2050 nm before and after the DCF-2000 fiber.
    Pin(mW)τin(fs)λSSFS(nm)ΔλSSFS(nm)PSSFS(mW)LDCF(cm)τSSFS(fs)
    393001700644972
    462671750725968
    532361800689.87676
    6020618506412.47677
    7214519007113.38880
    7911819508516.111583
    857620008016.414888
    10130205010119.517892
    1152721008619.8210107
    Table 1. Summary of the Obtained Results
    Grzegorz Soboń, Tadeusz Martynkien, Karol Tarnowski, Paweł Mergo, Jarosław Sotor. Generation of sub-100  fs pulses tunable from 1700 to 2100  nm from a compact frequency-shifted Er-fiber laser[J]. Photonics Research, 2017, 5(3): 151
    Download Citation