• Photonics Research
  • Vol. 11, Issue 10, 1687 (2023)
Xiutao Lou1, Yue Wang2, Ning Xu1, and Yongkang Dong3、*
Author Affiliations
  • 1School of Physics, Harbin Institute of Technology, Harbin 150001, China
  • 2Photonics Research Institute, Department of Electronic and Information Engineering, The Hong Kong Polytechnic University, Hong Kong, China
  • 3National Key Laboratory of Science and Technology on Tunable Laser, Harbin Institute of Technology, Harbin 150001, China
  • show less
    DOI: 10.1364/PRJ.492651 Cite this Article Set citation alerts
    Xiutao Lou, Yue Wang, Ning Xu, Yongkang Dong. Gas sensing with 7-decade dynamic range by laser vector spectroscopy combining absorption and dispersion[J]. Photonics Research, 2023, 11(10): 1687 Copy Citation Text show less
    Basic principle of LaVS. The left top panel shows the main configuration based on FMCW interferometry, and other parts show the procedure for simultaneously retrieving absorption and dispersion spectra of gases of different concentrations with different absorption path lengths.
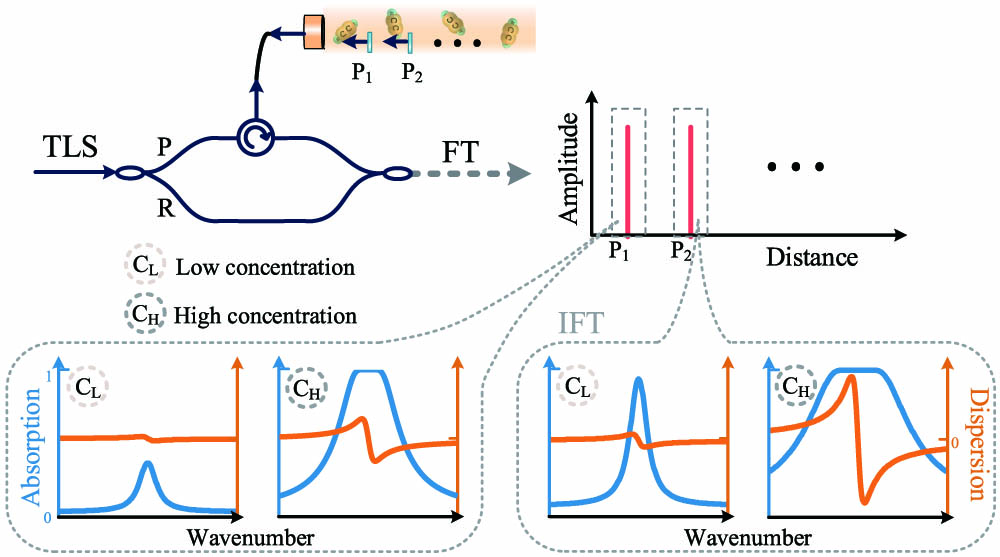
    Fig. 1. Basic principle of LaVS. The left top panel shows the main configuration based on FMCW interferometry, and other parts show the procedure for simultaneously retrieving absorption and dispersion spectra of gases of different concentrations with different absorption path lengths.
    Experimental setup of LaVS. The inset shows absorption line intensities of acetylene around 1520 nm. PC, polarization controller; FRM, Faraday rotation mirror; ATT, optical attenuator; BPD, balanced photodetector; DAQ, data acquisition.
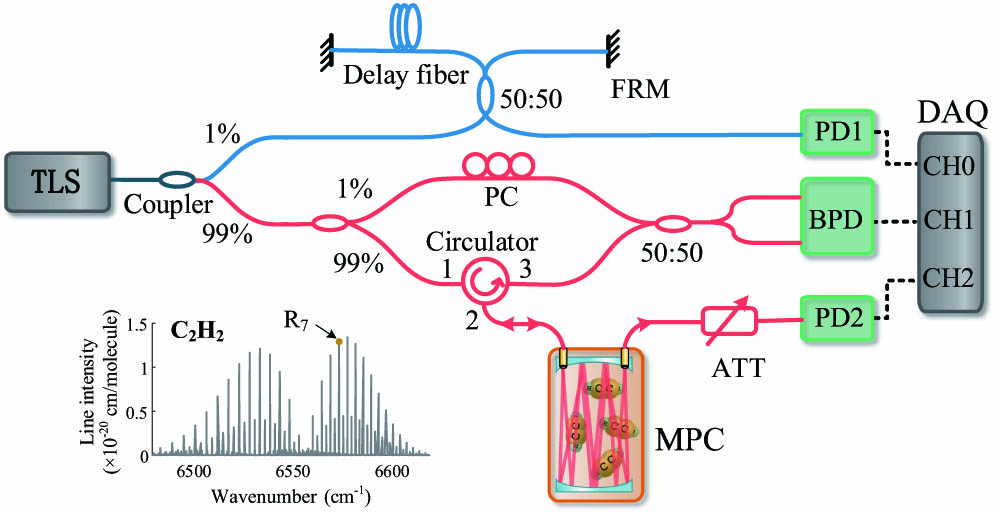
    Fig. 2. Experimental setup of LaVS. The inset shows absorption line intensities of acetylene around 1520 nm. PC, polarization controller; FRM, Faraday rotation mirror; ATT, optical attenuator; BPD, balanced photodetector; DAQ, data acquisition.
    Procedure for simultaneous retrieval of absorption and dispersion spectra of 8440-ppm acetylene filled in the MPC. (a) Recorded beat signals. (b) FT results of the beat signals shown in (a). (c) Retrieved absorption and dispersion spectra (each with 20 results averaged) by applying IFT to three reflection peaks (#5, #11, #17) indicated in (b). The inset in (c) is the enlargement of the end part of the spectrum, showing details of the oscillating noise due to spectral leakage in the FT process.
    Fig. 3. Procedure for simultaneous retrieval of absorption and dispersion spectra of 8440-ppm acetylene filled in the MPC. (a) Recorded beat signals. (b) FT results of the beat signals shown in (a). (c) Retrieved absorption and dispersion spectra (each with 20 results averaged) by applying IFT to three reflection peaks (#5, #11, #17) indicated in (b). The inset in (c) is the enlargement of the end part of the spectrum, showing details of the oscillating noise due to spectral leakage in the FT process.
    Measured and fitted absorption and dispersion spectra of acetylene of different concentrations with different absorption path lengths. (a), (b) For low concentrations of 102 ppm and 1090 ppm, with absorption path lengths of 19.386 m and 3.949 m, respectively. (c)–(e) For high concentrations of 8440 ppm, 9.3%, and 99.3%, with absorption path lengths of 6.103 m, 1.064 m, and 0.359 m, respectively. Each spectrum is an average of 20 scans.
    Fig. 4. Measured and fitted absorption and dispersion spectra of acetylene of different concentrations with different absorption path lengths. (a), (b) For low concentrations of 102 ppm and 1090 ppm, with absorption path lengths of 19.386 m and 3.949 m, respectively. (c)–(e) For high concentrations of 8440 ppm, 9.3%, and 99.3%, with absorption path lengths of 6.103 m, 1.064 m, and 0.359 m, respectively. Each spectrum is an average of 20 scans.
    Results of absorption spectra in the transmission mode. (a) Measured and fitted absorption spectra of 1.2-ppm and 8-ppm acetylene with an absorption path length of 41.961 m. Each spectrum is averaged over 20 scans. (b) Allan-Werle deviation plots yielded by continuous measurement results of 1.2-ppm acetylene during 240 s (shown in the inset).
    Fig. 5. Results of absorption spectra in the transmission mode. (a) Measured and fitted absorption spectra of 1.2-ppm and 8-ppm acetylene with an absorption path length of 41.961 m. Each spectrum is averaged over 20 scans. (b) Allan-Werle deviation plots yielded by continuous measurement results of 1.2-ppm acetylene during 240 s (shown in the inset).
    Plots of measured acetylene concentrations versus assumed ones. Each error bar shows the standard error of the mean of 20 measurement results and is magnified 20 times for clarity.
    Fig. 6. Plots of measured acetylene concentrations versus assumed ones. Each error bar shows the standard error of the mean of 20 measurement results and is magnified 20 times for clarity.
    TechniquePrincipleAuxiliary TechniqueGasWavelength (μm)Dynamic RangeReference
    LaVSAbsorption and dispersionNoneC2H21.526×107This work
    OPMASAbsorptionNoneC2H21.521.9×106[21]
    SCARAbsorptionNoneC14O1624.5103[17]
    CRDSAbsorptionGas dilutionCH41.655×105[11]
    TDLASAbsorptionTwo gas cellsHg0.2541×106[9]
    WMSAbsorptionTwo absorption linesH2O1.854106[8]
    CMDSDispersionNoneCO1.562×105[35]
    PASPhotoacousticNoneC2H21.5321×108[16]
    MPD-PTSPhotothermalNoneC2H21.5332×107[15]
    Table 1. Comparison of Dynamic Range of Typical State-of-the-Art Laser Spectroscopic Gas Sensorsa
    Xiutao Lou, Yue Wang, Ning Xu, Yongkang Dong. Gas sensing with 7-decade dynamic range by laser vector spectroscopy combining absorption and dispersion[J]. Photonics Research, 2023, 11(10): 1687
    Download Citation