Xiutao Lou, Yue Wang, Ning Xu, Yongkang Dong, "Gas sensing with 7-decade dynamic range by laser vector spectroscopy combining absorption and dispersion," Photonics Res. 11, 1687 (2023)
Copy Citation Text
Laser absorption spectroscopy (LAS) has been widely used for unambiguous detection and accurate quantification of gas species in a diverse range of fields. However, up-to-date LAS-based gas sensors still face challenges in applications where gas concentrations change in a wide range, since it is extremely difficult to balance spectral analysis strategies for different optical thicknesses. Here we present laser vector spectroscopy that combines absorption spectroscopy with dispersion spectroscopy, simultaneously taking advantage of the former’s high sensitivity in the low-concentration region and the latter’s high linearity in the high-concentration region. In the proof-of-concept demonstration of acetylene measurement, it achieves a linear dynamic range of (), which surpasses all other state-of-the-art LAS techniques by more than an order of magnitude, with the capability of highly accurate quantification retained. The proposed laser spectroscopic method paves a novel way of developing large-dynamic-range gas sensors for environmental, medical, and industrial applications.
1. INTRODUCTION
Gas sensing has an increasing impact across a wide range of applications including environmental monitoring, medical diagnostics, and industrial process control [1–7]. As one of the most important performance metrics, sensing dynamic range is particularly concerned in applications such as analyzation of gas species in the atmosphere at different altitudes [8], certification for standard gas generators [9], accurate monitoring of combustion efficiency [10], and identification of greenhouse gas sources [11], where detected gas concentrations often span more than 5 orders of magnitude. Laser spectroscopy has been established as a powerful mainstream technique because of its high selectivity and fast response. Among various laser spectroscopic techniques, zero-background photoacoustic spectroscopy (PAS) and photothermal spectroscopy (PTS) present an intrinsic advantage in dynamic range spanning 5–7 decades [12–15]. Recently, Wang et al. demonstrated acetylene detection by PAS with a combination of acoustic and optical resonance enhancement, achieving an unprecedented dynamic range of 8 decades [16]. However, for PAS and PTS, long-term quantitative measurement can only be guaranteed by rigid calibration due to their susceptibility to variations in light intensity and gas composition [13]. Different from PAS and PTS, laser absorption spectroscopy (LAS) has to extract absorption information from a baseline, which makes it difficult to balance the weak absorption and strong absorption, leading to a limited dynamic range at a general level of 3–4 decades [17–20]. But, on the other hand, the baseline in LAS offers a valuable reference to realize highly accurate quantification with simple operation, which makes LAS become the most widely used laser spectroscopic technique at present. Therefore, it is of great importance to effectively extend the dynamic range of LAS to meet practical application requirements.
In fact, many investigations have been pursued enlarging the LAS’s dynamic range. Regardless of the system complexity, a conventional way is to incorporate a gas dilution unit, which has been demonstrated for cavity-enhanced methane detection spanning concentrations of 6 orders of magnitude from parts per million (ppm) to pure analyte [11]. Another possible approach is to select gas transition lines with different strengths, which has been demonstrated for measuring water vapor concentrations spanning 6 decades [8], but the premise is that the laser source has adequate spectral coverage. A much more straightforward alternative is to change the absorption path length, which is currently the strategy gaining the most attention. Srivastava and Hodges combined a single-pass cell and a multipass cell (MPC) for the measurement of gaseous elemental mercury, extending the dynamic range to 6 decades [9]. Recently, we have demonstrated a method called optical path length multiplexed absorption spectroscopy (OPMAS) [21], which adopts frequency-modulated continuous-wave (FMCW) interferometry to interrogate absorption information with different path lengths inside an MPC [22]. The core idea of FMCW is frequency multiplexing which has also been employed for multipoint gas sensing [23,24]. Without gas dilution, selecting one absorption line and using a single gas cell, OPMAS achieves a record 6-decade dynamic range that surpasses other LAS techniques by more than 2 orders of magnitude.
In this paper, based on the previous works, we propose an innovative and powerful large-dynamic-range gas sensing method named laser vector spectroscopy (LaVS) that combines LAS and dispersion spectroscopy (DS). It employs FMCW interferometry to simultaneously obtain absorption and dispersion spectral information of the target gas and takes advantage of both of them. In general, LAS has a better sensitivity than DS, since the latter is susceptible to phase noise of the laser source [25]. On the other hand, since DS measures refractive index changes due to gas absorption rather than light attenuation, it offers an advantage of highly linear response especially in optically thick regions [26]. Additionally, DS possesses the same capability of highly accurate quantification as LAS, as dispersion is related to absorption through the Kramers–Kronig (K-K) relations. We experimentally demonstrate a linear dynamic range of larger than 7 decades, which enables more challenging gas sensing applications where highly quantitative measurements of gas concentration changing in a vast range are required.
Sign up for Photonics Research TOC. Get the latest issue of Photonics Research delivered right to you!Sign up now
2. PRINCIPLE
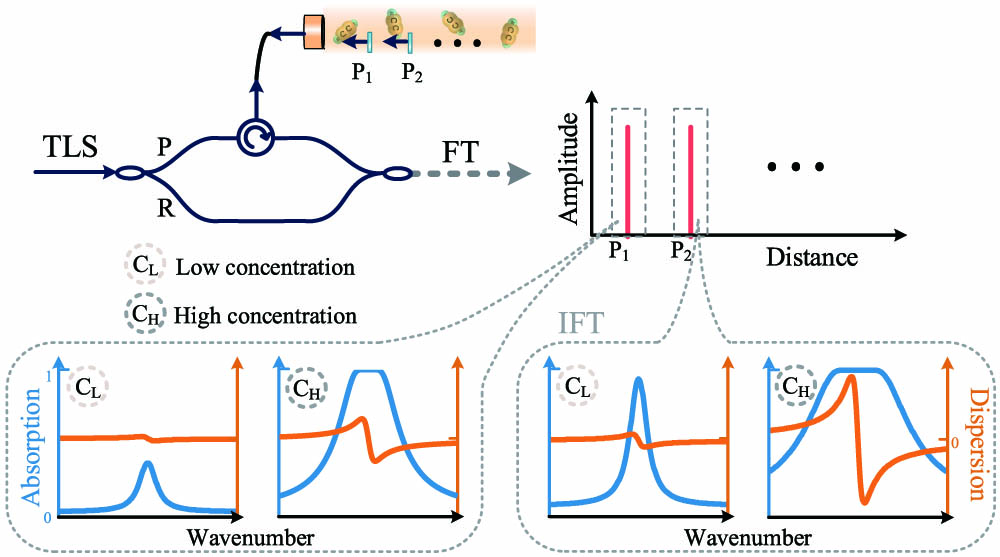
The concept and principle of LaVS are shown in Fig. 1, which includes the main configuration based on FMCW interferometry and the procedure for simultaneous retrieval of gas absorption and dispersion spectra. A gas cell with multiple internal weak reflections is placed in the probe arm of the interferometer to incorporate the optical path length multiplexing scheme (the principle is detailed in Ref. [21]). By FMCW interferometry, spectral information from different reflection positions inside the gas cell corresponding to different optical path lengths is interrogated for analyzing gases of different concentrations. The whole optical path length of the gas cell is adopted as well for trace gas sensing, which is similar to the conventional LAS. The absorption spectra and dispersion spectra are simultaneously retrieved by FMCW interferometry in the two end concentration regions, and only absorption or dispersion spectra can be accurately retrieved. To measure low-concentration gases, absorption spectra with relatively high signal-to-noise ratio (SNR) are employed. The lower the concentration, the longer the optical path length is adopted, and vice versa. To measure high-concentration gases that induce strong absorption even with short path lengths, causing difficulties for spectral fitting, dispersion spectra having a linear response at optically thick conditions are adopted. To clearly present the difference of spectral responses in conditions of different optical thicknesses, absorption and dispersion spectra for different gas concentrations with different optical path lengths are illustrated in Fig. 1.
Figure 1.Basic principle of LaVS. The left top panel shows the main configuration based on FMCW interferometry, and other parts show the procedure for simultaneously retrieving absorption and dispersion spectra of gases of different concentrations with different absorption path lengths.
The phenomenon that light experiences both absorption and dispersion can be described by the transfer function of optical field [27]: in which is complex wavenumber, is the optical angular frequency, is the absorption path length, and is the speed of light in vacuum. The refractive index and absorption coefficient are related to each other by the K-K relations. In the FMCW interferometer, the returned probe (P) light carrying absorption and dispersion spectral information is combined with the reference (R) light to generate beat notes, which are detected using an AC-coupled detector and the voltage output is expressed as [22,25] where denotes the th reflection points in the probe arm, is the time delay between the probe and reference light, and is a constant that encompasses the detector responsivity, reflectivity of the reflection point, and optical loss excluding gas absorption. Due to different delay times, beat notes belonging to different reflection points have different beat frequencies, and thus can be separated after Fourier transformation (FT). Then, by applying inverse FT to each individual beat term in the positive time domain, we can obtain
The spectral transmittance is then given by
The phase change can be readily extracted (with unwrap operation) by where arctan2 is the two-argument arctangent function. Practically, the light intensity normalization in Eq. (4) is always carried out using a fitted baseline. The linear term in Eq. (5) can be regarded as a phase background changing linearly with , and thus can be simply deducted by applying a linear fit.
3. EXPERIMENT
A. Setup of LaVS
A schematic of the experimental arrangement of LaVS is shown in Fig. 2. The setup is mainly based on an FMCW configuration including a Mach–Zehnder measurement interferometer and a Michelson auxiliary interferometer. Acetylene is used as the sample gas, which is filled in the MPC located in the probe arm of the measurement interferometer. With the base length of 18 cm and pass number of 232, the MPC has a transmission path length of about 42 m and offers 232 different internal path lengths that can be multiplexed. The employed external-cavity diode laser (SANTEC, TLS-770) is scanned from 1520.81 to 1521.31 nm () at a tuning rate of 10 nm/s, with a linewidth of 60 kHz and an average output power of 10 mW. This 0.5-nm scanning range covers the relatively strong line in the band of acetylene and can effectively avoid interference from water vapor. Each scan takes 0.4 s, which contains 0.05-s forward tuning time, and 0.35-s return and initialization time, corresponding to a measurement duty cycle of 12.5%. Most () of the laser power is allotted to the probe arm of the measurement interferometer. The reflected probe light from the MPC is combined with the reference light, and the generated beat notes are detected by an 80-MHz AC-coupled balanced photodetector. In the auxiliary interferometer, a 40-m delay fiber is placed in one arm, and the generated beat signals are received using an AC photodetector (PD1) and are employed with the Hilbert-transform algorithm to trace and correct the nonlinearity of laser frequency tuning [28]. After attenuation, the transmitted light through the MPC is received by a DC photodetector (PD2). The transmitted signals are used for trace gas analysis, since such a transmission mode has advantages of long absorption path length and relatively low interference noise. Output voltage signals from these three PDs are recorded simultaneously using a data acquisition card (JYTEK, PCIe-69834) at a sampling rate of 20 MHz.
Figure 2.Experimental setup of LaVS. The inset shows absorption line intensities of acetylene around 1520 nm. PC, polarization controller; FRM, Faraday rotation mirror; ATT, optical attenuator; BPD, balanced photodetector; DAQ, data acquisition.
B. Procedure of Simultaneously Retrieving Absorption and Dispersion Spectra
For a description of the procedure of spectra retrieval, 8440-ppm acetylene filled in the MPC is taken as the sample gas. Figure 3(a) shows the acquired beat signals after correction of frequency nonlinearity by Hilbert resampling. The envelope clearly presents the gas absorption. As described by Eq. (2), the detected beat signals encompass lots of beat notes corresponding to different reflection points in the probe path. Transforming the original signals into the spatial domain by applying FT, reflection signals from different positions including 232 reflection points inside the MPC can be separated, as shown in Fig. 3(b). The spatial resolution determined by (in which is the tuning range of laser frequency) is estimated to be 2.3 mm. As examples, three reflection peaks (#5, #11, #17) with round-trip path lengths of 1.795 m, 3.949 m, and 6.103 m, respectively, are selected by rectangular windows with the width of 18 cm. By applying inverse Fourier transformation (IFT), their individual beat signals are obtained, as described by Eq. (3). Then, following Eqs. (4) and (5), corresponding absorption and dispersion spectra are obtained, as shown in Fig. 3(c). The spectral resolution, which is determined by [29], is estimated to be 0.83 GHz or , which is less than one-fifth of the acetylene absorption linewidth and thus sufficient for high-selectivity gas sensing. The periodically oscillating noise is attributed to spectral leakage in the FT process, which can be effectively suppressed by the Savitzky–Golay smoothing algorithm [30]. For accuracy, data at the start and the end of the spectral signal (with a proportion of 20%) having relatively large oscillating noise would be cut off before further spectral data processing. As can be clearly seen, in the condition of long path length, the center part of the absorption profile touches the top, which makes spectral analysis difficult. By contrast, the amplitude of dispersion signal increases linearly with absorption path length even in optically thick conditions. Therefore, extending the upper detection limit (UDL) using dispersion signals can be reasonably expected.
Figure 3.Procedure for simultaneous retrieval of absorption and dispersion spectra of 8440-ppm acetylene filled in the MPC. (a) Recorded beat signals. (b) FT results of the beat signals shown in (a). (c) Retrieved absorption and dispersion spectra (each with 20 results averaged) by applying IFT to three reflection peaks (#5, #11, #17) indicated in (b). The inset in (c) is the enlargement of the end part of the spectrum, showing details of the oscillating noise due to spectral leakage in the FT process.
To experimentally demonstrate the large-dynamic-range sensing capability of the proposed laser spectroscopic method, acetylene of seven different concentrations spanning more than 6 decades (from ppm level to nearly pure analyte: 1.2 ppm, 8 ppm, 102 ppm, 1090 ppm, 8440 ppm, 9.3%, and 99.3%) is measured. Figure 4 shows obtained absorption and dispersion spectra of five acetylene sample gases with concentrations above 100 ppm. The spectral result for each concentration is an average of 20 scans taking 8 s. For relatively low concentrations of 102 and 1090 ppm, absorption spectra offer better SNR than dispersion spectra, and thus are used for gas analysis. For high concentrations of 8440 ppm, 9.3%, and 99.3%, even using the shortest round-trip path length, the absorption is more than 50%, leading to increasing difficulties for accurate spectral fitting. In these three high-concentration cases, dispersion spectra with short path lengths (the highest concentration 99.3% uses the shortest round-trip path length 0.359 m) would be used, since they provide a highly linear response. At the highest concentration of 99.3%, there exists a slight discrepancy between the measured and the fitted dispersion profiles, which might be attributed to the low light intensity received or absorptions by impurities.
Figure 4.Measured and fitted absorption and dispersion spectra of acetylene of different concentrations with different absorption path lengths. (a), (b) For low concentrations of 102 ppm and 1090 ppm, with absorption path lengths of 19.386 m and 3.949 m, respectively. (c)–(e) For high concentrations of 8440 ppm, 9.3%, and 99.3%, with absorption path lengths of 6.103 m, 1.064 m, and 0.359 m, respectively. Each spectrum is an average of 20 scans.
For ppm-level low concentrations of 1.2 and 8 ppm, absorption spectra obtained from the transmitted light through the MPC offering high SNR are adopted, which are shown in Fig. 5(a). The retrieval procedure of absorption spectra in the transmission mode is almost the same as traditional LAS [31,32]. To evaluate the minimum detection concentration (MDC) of the laser spectroscopic system, Allan-Werle variance analysis is performed on continuous measurements of 1.2-ppm acetylene during 240 s [33]. Figure 5(b) shows Allan-Werle deviation plots, which indicate the optimum time for signal averaging is 24 s (corresponding to 60 scans averaged), at which the achieved MDC of the system is 0.016 ppm (corresponding to normalized MDC of ).
Figure 5.Results of absorption spectra in the transmission mode. (a) Measured and fitted absorption spectra of 1.2-ppm and 8-ppm acetylene with an absorption path length of 41.961 m. Each spectrum is averaged over 20 scans. (b) Allan-Werle deviation plots yielded by continuous measurement results of 1.2-ppm acetylene during 240 s (shown in the inset).
The absorption coefficient is commonly used for quantitative gas sensing. At atmospheric pressure, the absorption profile can be described by a Lorentzian function and the absorption coefficient is expressed as where is the absorption line strength, which is a constant at a certain temperature; is the number density of gas molecule; is the center wavenumber of absorption; and is the absorption full width at half-maximum (FWHM). The FWHM is mainly determined by collisional broadening from both the analyte itself and the buffer gas (usually the air). In conditions of low target-gas concentration, the air-broadening mechanism dominates and the FWHM can be regarded as a constant. Accordingly, is linearly proportional to . However, when the target gas is of high concentration, the self-broadening cannot be neglected and can even be dominant. Since the self-broadening is much different from the air-broadening (for acetylene the former is about twice the latter [34]), is much dependent on the gas component matrix. As clearly shown in Fig. 4, the peak-to-trough width of the dispersion curve (corresponding to the absorption FWHM) of the highest concentration 99.3% is obviously larger than the other four relatively lower concentrations ( versus ). In high-concentration cases, with the being not a constant, the linear relationship between and is no longer tenable. Hence, for gas analysis in a large dynamic range, here we use the product of the absorption coefficient at line center and the FWHM: which always keeps a linear relationship with at any level. Figure 6 shows measured concentrations plotted versus assumed values. For low concentrations at the 100-ppm level and below, absorption spectra with better SNR are adopted; for high concentrations at the 10,000-ppm level up to pure analyte, dispersion spectra with better linearity are used; for intermediate concentrations at the 1000-ppm level, both absorption and dispersion spectra have relatively high SNR and linearity, and are simultaneously employed to improve the measurement accuracy and precision. The value of the linear fit is more than 0.9999, indicating a nearly perfect linear response of the system. The sensing dynamic range is delimited by both the lower detection limit (LDL) and the UDL. Taking the MDC of 0.016 ppm as the LDL and the measured highest concentration of 99.3% as the UDL, the dynamic range experimentally realized by the current laser spectroscopic system is evaluated to be . It is noted that measurement errors are relatively large at the minimum and the maximum concentrations. At low concentrations the increase of measurement error is due to the weak absorption, whereas at high concentrations the growth of measurement error is mainly attributed to the relatively low light intensity received.
Figure 6.Plots of measured acetylene concentrations versus assumed ones. Each error bar shows the standard error of the mean of 20 measurement results and is magnified 20 times for clarity.
For a direct comparison on dynamic range, Table 1 lists some state-of-the-art laser spectroscopic gas sensing techniques. LaVS offers a dynamic range of more than one order of magnitude larger than all other up-to-date absorption-based techniques (dispersion technique can be regarded as a variant of absorption method) even including those using auxiliary approaches. It is noteworthy that the achieved performance in dynamic range even surpasses that of advanced zero-background technique PTS. Although the dynamic range achieved is still 0.7 times lower than that of another zero-background technique PAS, our proposed method has unique advantages of simple operation and highly accurate quantification by comparison.
Comparison of Dynamic Range of Typical State-of-the-Art Laser Spectroscopic Gas Sensorsa
In conclusion, we have proposed and demonstrated a novel method LaVS for large-dynamic-range gas sensing. It combines laser absorption and laser dispersion schemes, simultaneously taking advantage of LAS’s high sensitivity in the low-concentration region and DS’s high linearity in the high-concentration region. In the proof-of-principle demonstration of acetylene measurement, an ultra-large dynamic range of 7 decades is achieved, which is more than one order of magnitude larger than that of all other up-to-date LAS techniques. Owing to the inherent quantitative relation between absorption and dispersion, LaVS possesses the same capability of accurate quantification as LAS. The proposed laser spectroscopic method is also compatible with other auxiliary methods such as gas dilution, use of multiple gas cells, and employment of different transition lines, which could further expand the dynamic range and enable more challenging gas sensing applications. Owing to the high performance at optically thick regions, extending the application of LaVS to liquid sensors could be reasonably expected.
[23] G. Plant, A. Hangauer, M. Huang, T. Wang, G. Wysocki. Gas sensing fiber network with simultaneous multi-node detection using range-resolved chirped laser dispersion spectroscopy. Conference on Lasers and Electro-Optics, SM2O.1(2015).