
Chun-Wang Ma, Dan Peng, Hui-Ling Wei, Zhong-Ming Niu, Yu-Ting Wang, R. Wada. Isotopic cross-sections in proton induced spallation reactions based on the Bayesian neural network method *[J]. Chinese Physics C, 2020, 44(1):
- Chinese Physics C
- Vol. 44, Issue 1, (2020)
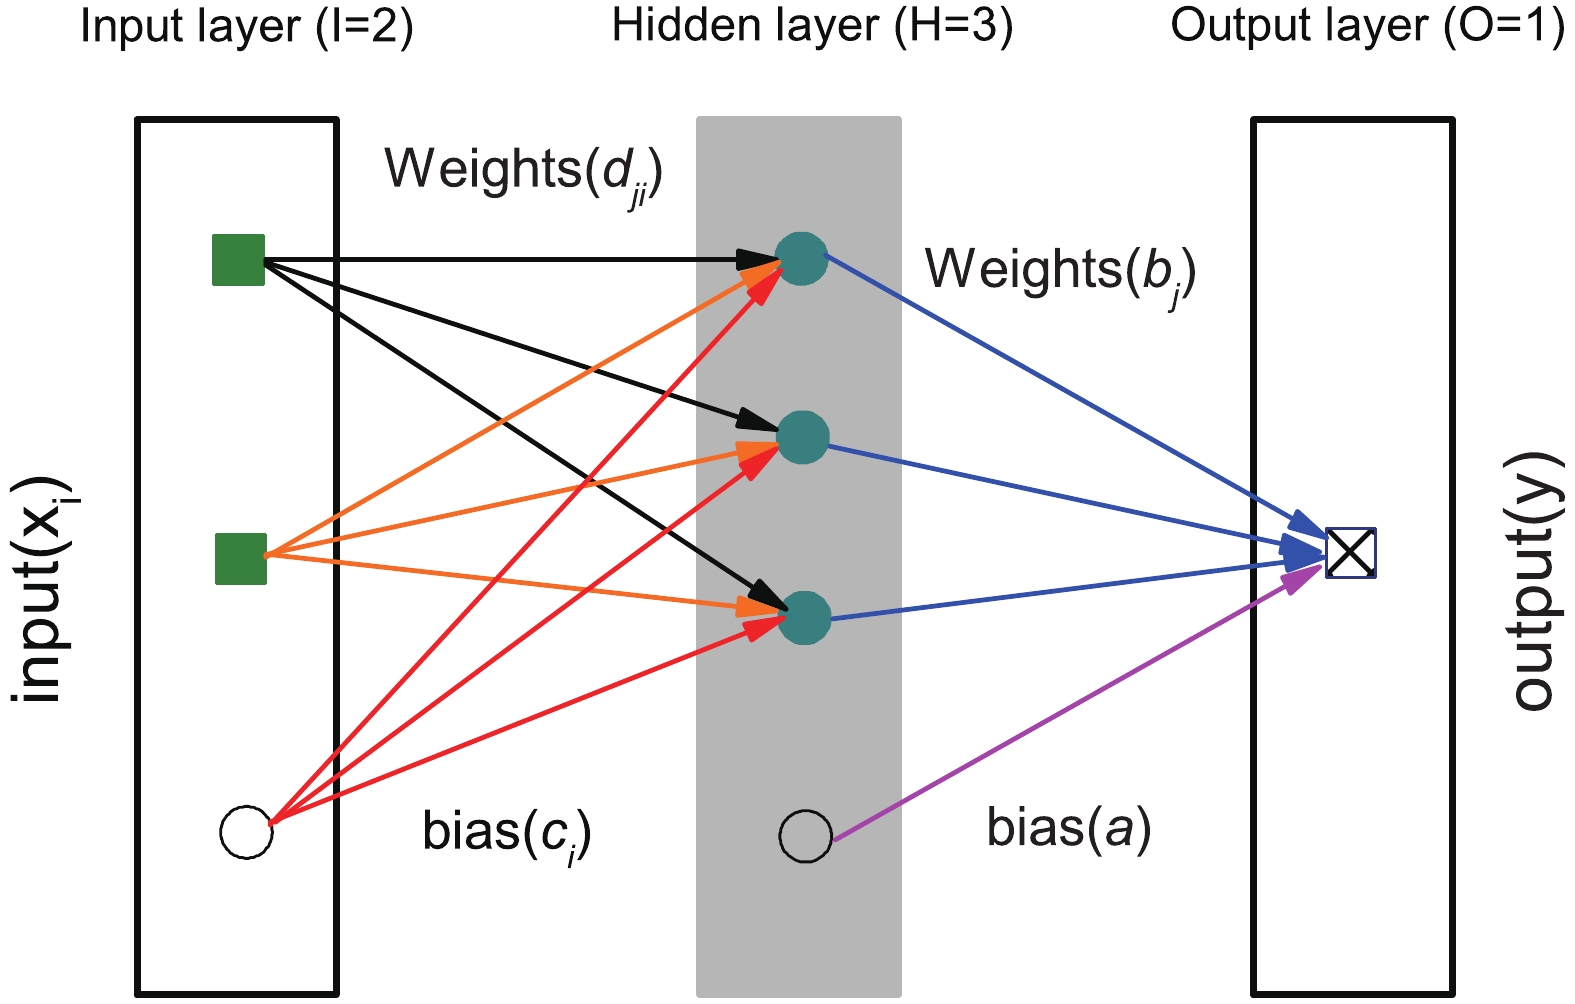
Fig. 1. (color online) A schematic diagram of a neural network with a single hidden layer, three hidden neurons (H = 3) and two input variables (I = 2).
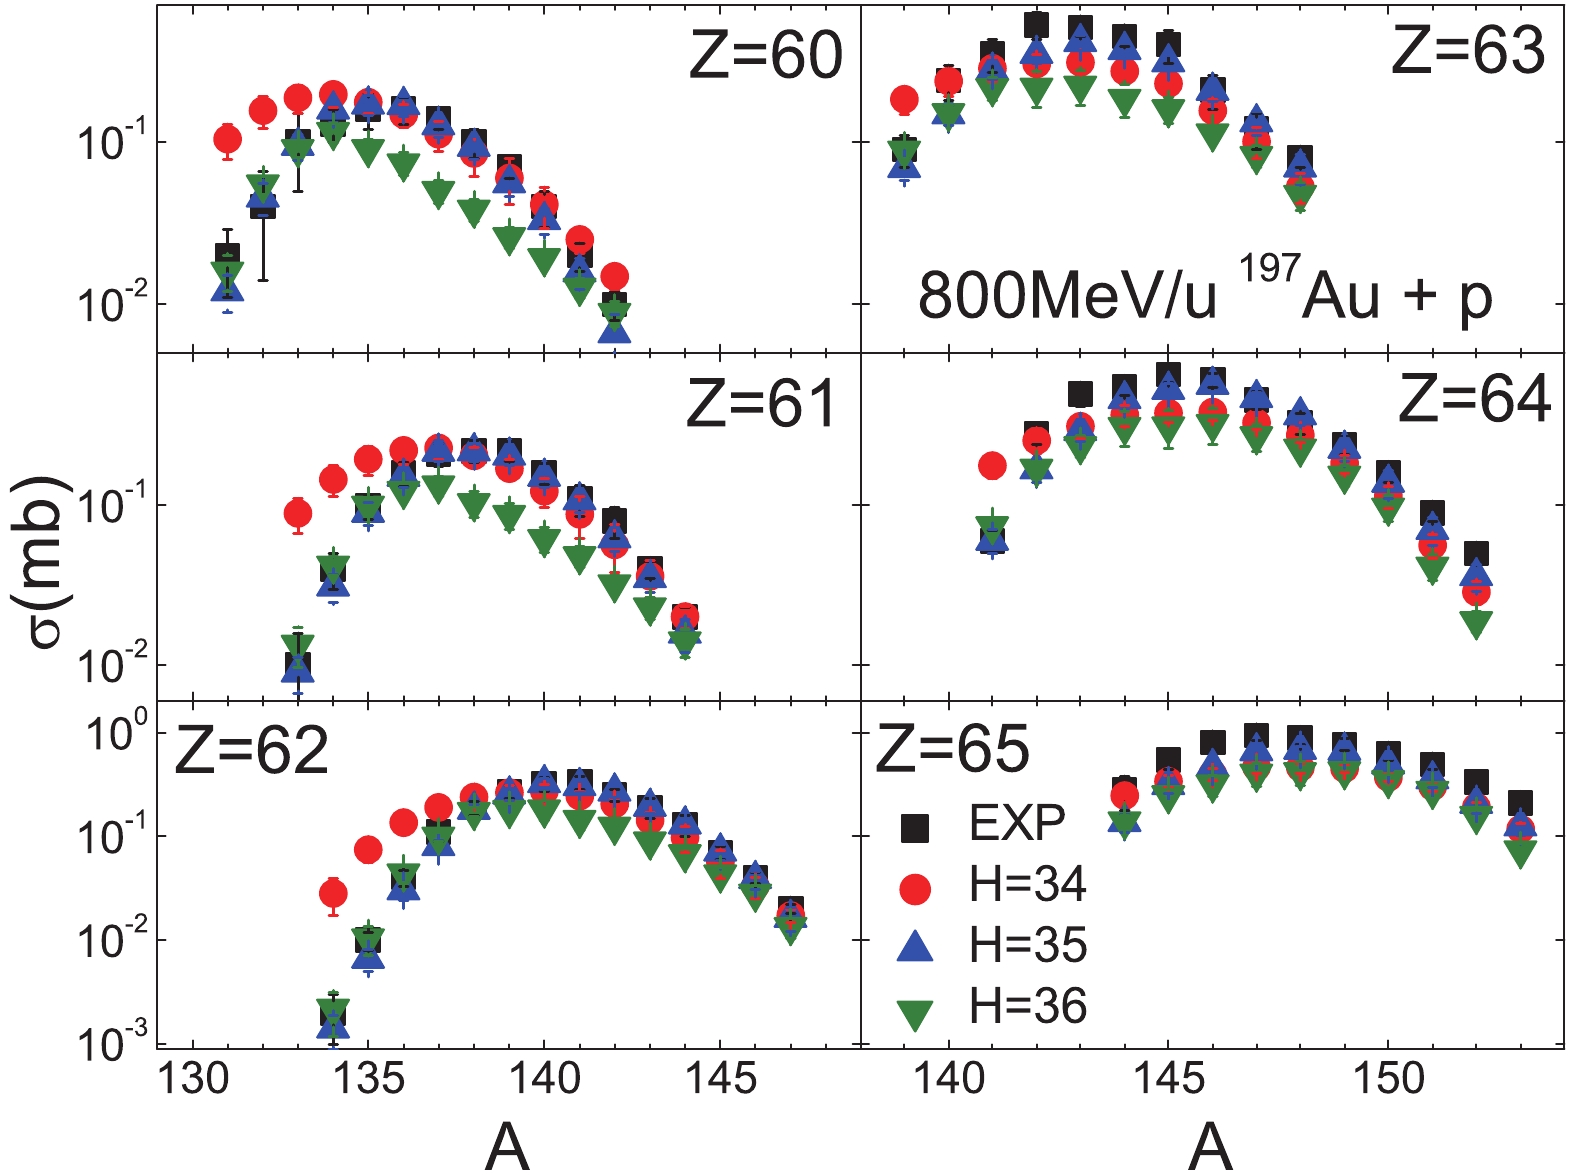
Fig. 2. (color online) BNN predictions for selected residue fragments with Z =60 to 65 in the 800 MeV/u 197Au + p spallation reaction. Three different numbers of hidden nodes are tested, H = 34 (circles), 35 (triangles), 36 (triangles). The measured results are shown as black squares.
Fig. 3. (color online) Similar as Fig. 2 , but for Z =66 to 73.
Fig. 4. (color online) Similar as Fig. 2 , but for Z =75 to 80.
Fig. 5. (color online) BNN predictions for the 500 MeV/u 56Fe + p reaction with H = 34, 35 and 36. The results for the selected residues Z =10 to 15 are compared to the measured residue fragments [41 ]. The symbols are the same as in Fig. 2 .
Fig. 6. (color online) Similar as Fig. 5 , but for Z = 16 to 21.
Fig. 7. (color online) Similar as Fig. 5 , but for Z = 22 to 27.
Fig. 8. (color online) BNN predictions (with TS1 and H = 35) (circles) for selected fragments with Z = 3 to 22 in the 1000 MeV/u 136Xe + p spallation reaction, compared to the experimental data (squares, from [44 ]) and the SPACS results (triangles, from [25 ]. The experimental and BNN error bars are smaller than the symbols.
Fig. 9. (color online) Similar as Fig. 8 , but for Z = 36 to 54.
Fig. 10. (color online) Predictions of isotopic distributions by BNN (squares) and SPACS (circles) for the 1000 MeV/u 238U + p spallation reaction for Z = 54 to 70 [48 ]. Experimental distributions are not available for
Fig. 11. (color online) Similar as Fig. 8 , but for 1000 MeV/u 238U + p and for Z = 74 to 92.
Fig. 12. (color online) Similar as Fig. 8 , but for the 763 MeV/u 40Ca + p spallation reaction [9 ]. Experimental data are not available for fragments with
Fig. 13. (color online) Similar as Fig. 8 , but for the 361 MeV/u 36Ar + p reaction with Z = 3 to 17 [8 ].
Fig. 14. (color online) Correlation between the isotopic cross-sections and the average binding energy B' . The squares, triangles, and circles denote the measured data, BNN predictions, and SPACS predictions, respectively. The lines denote the linear fit of the correlation between
B' .
|
Table 1. The number of measured fragments in 19 measured
|
Table 2. The number of fragments in spallation reactions predicted using the SPACS parametrization.

Set citation alerts for the article
Please enter your email address
© Copyright 2018-2021 | Chinese Laser Press. All Rights Reserved 沪ICP备15018463号-20