
Jingyun Zhao, Liguo Qin, Xunming Cai, Qiang Lin, Zhongyang Wang. Parity chain and parity chain breaking in the two-level cavity quantum electrodynamics system[J]. Chinese Optics Letters, 2017, 15(5): 050202
- Chinese Optics Letters
- Vol. 15, Issue 5, 050202 (2017)
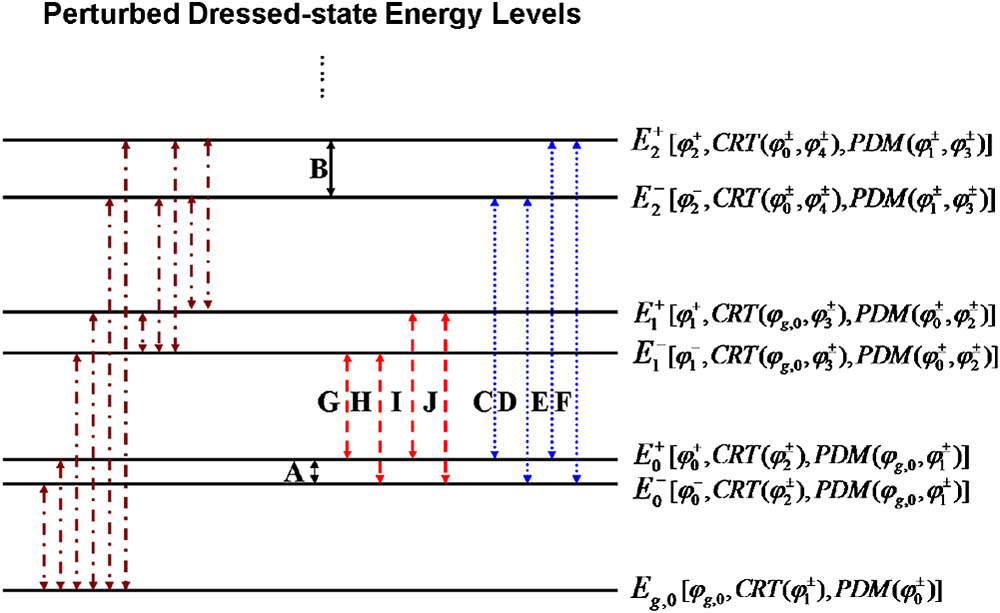
Fig. 1. Transitions between the perturbed energy levels with the first-order perturbed dressed states. The three terms in the parentheses on the right side of the figure separately represent the unperturbed dressed state and the dressed states caused by the CRT and PDM. The arrows represent the 21 frequency components, where the main probability transitions are labeled by the alphabet “A, B, …, J”.
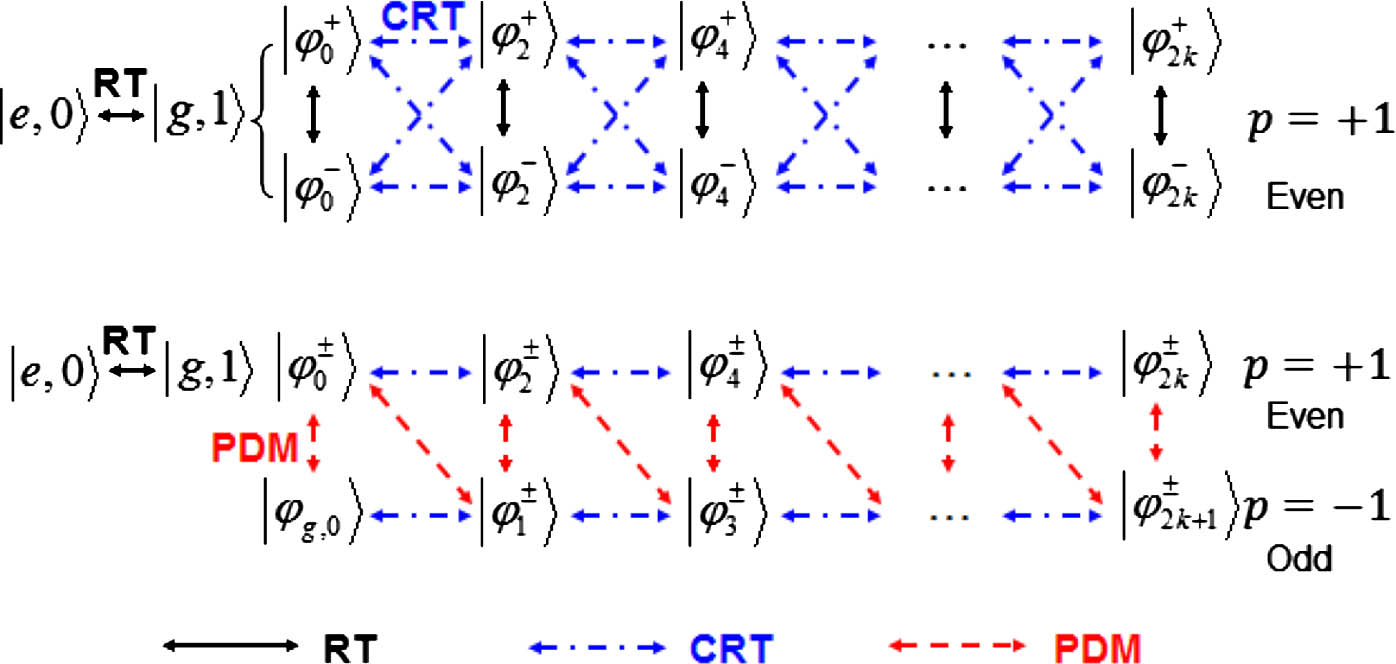
Fig. 2. Transitions between the dressed-state energy levels caused by the RT, CRT and, PDM in the parity chains, respectively. The initial state of the system starts is | e , 0 〉
Fig. 3. Population differences 〈 σ z ( t ) 〉 f = λ / ω c α f = 0.01 α = 1 , 5 f = 0.1 α = 0.5 , 1
Fig. 4. Fourier transform of the population difference at the resonance for different normalized permanent dipole difference α λ = 0.1 ω c α = 0.5 α = 1 1 . Our dressed-state perturbation theory (blue dot–dashed lines) are compared to the numerical simulation results (red solid lines).

Set citation alerts for the article
Please enter your email address
© Copyright 2018-2021 | Chinese Laser Press. All Rights Reserved 沪ICP备15018463号-20