
Zhaoxi Chen, Jingwei Yang, Wing-Han Wong, Edwin Yue-Bun Pun, Cheng Wang, "Broadband adiabatic polarization rotator-splitter based on a lithium niobate on insulator platform," Photonics Res. 9, 2319 (2021)
- Photonics Research
- Vol. 9, Issue 12, 2319 (2021)
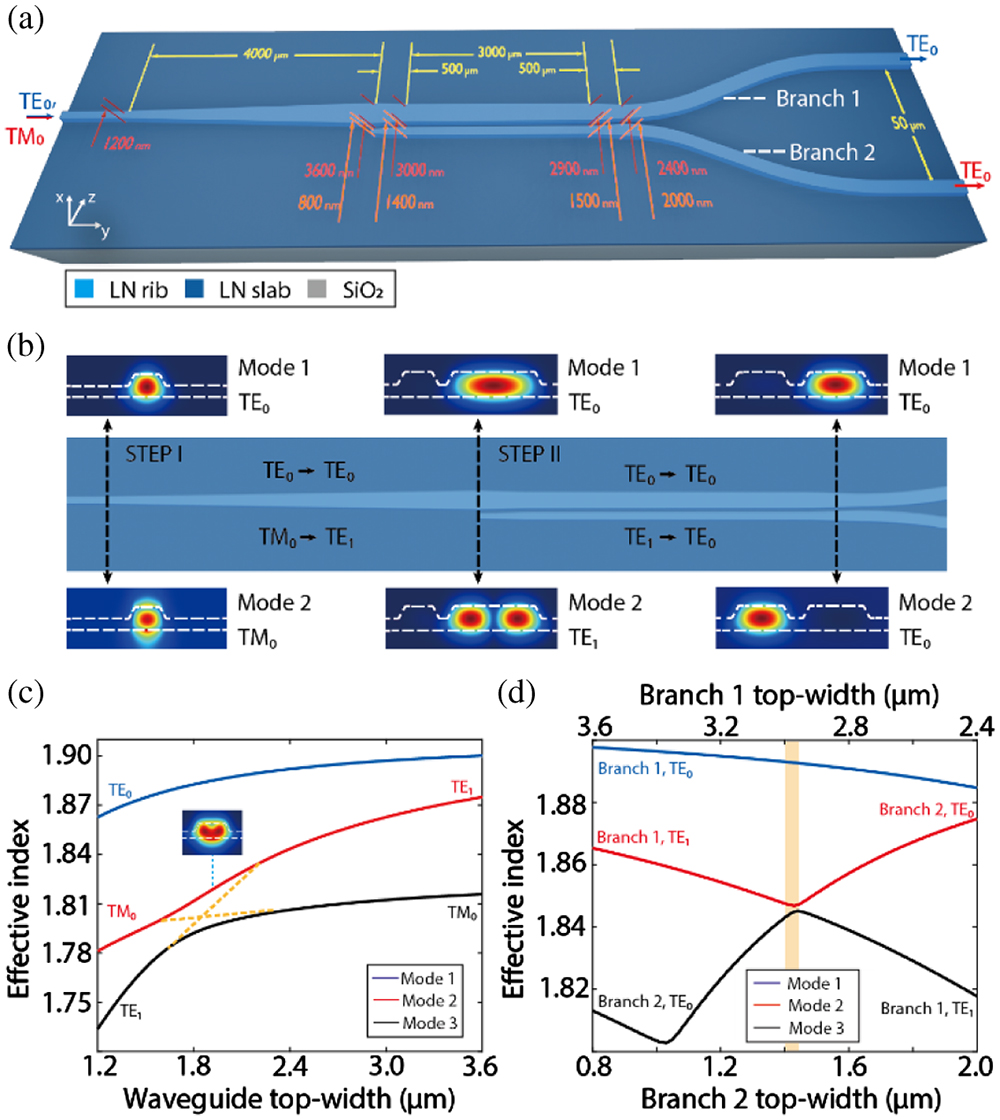
Fig. 1. (a) Schematic of the polarization rotator-splitter (PRS). In each taper section, the top widths of Branch 1 (Branch 2) are labeled in red (orange); lengths are labeled in yellow. (b) Optical eigenmode profiles (electric field intensity, viewed from the receiving end) at different locations along the PRS. Top (Mode 1) and bottom (Mode 2) profiles correspond to mode evolutions for TE 0 TM 0 n eff TM 0 TE 1
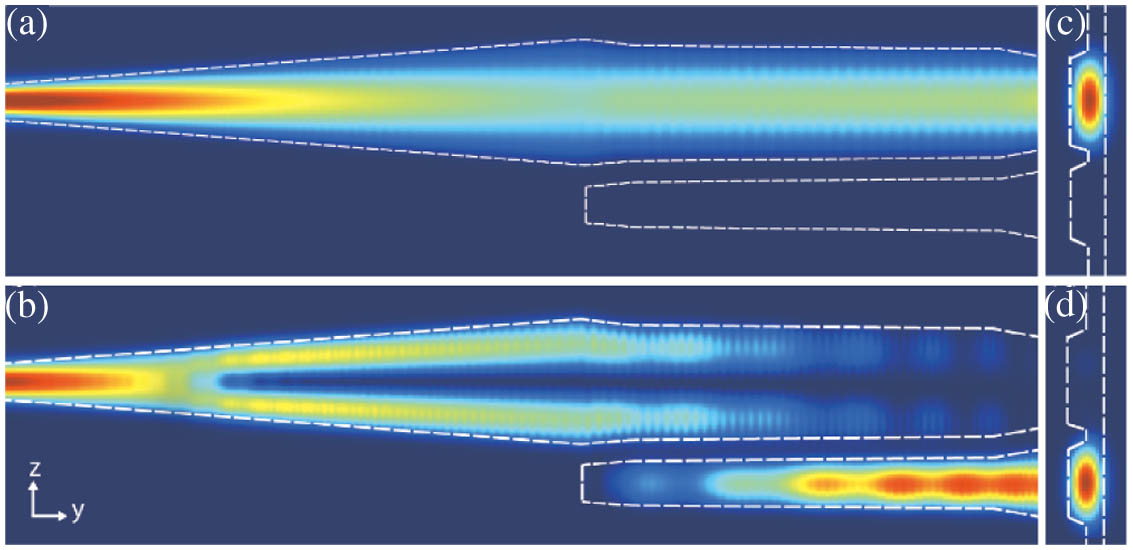
Fig. 2. (a), (b) Simulated electric field intensity evolution along the PRS for (a) TE 0 TM 0 y z E z TE 0 TM 0
Fig. 3. Scanning electron microscope (SEM) images of (a) the polarization splitter (Step II) and the output bends, and the zoom-in views of (b) the adiabatic coupler and (c) the output straight waveguide.
Fig. 4. (a) Experimental setup for output mode characterization. The free-space fiber-bench polarization controller (FFBPC) consists of a quarter-wave plate (QWP), a linear polarizer (LP), and a second QWP. (b) Infrared camera images of the mode profiles at the device output facet in cases of various input polarization states. The top row (i, ii, and iii) shows the output from a device with Step I only (objective lens NA = 0.45 Step I + Step II NA = 0.30
Fig. 5. Measured optical transmission spectra at the PRS output (a) Port 1 and (b) Port 2 in the wavelength range of 1500–1630 nm. Black and red curves correspond to TE 0 TM 0
Fig. 6. Simulated mode hybridization points as functions of wavelength in (a) Step I rotator and (b) Step II splitter. The shaded area indicates the actual tapering regions in our device.


Set citation alerts for the article
Please enter your email address

© Copyright 2018-2021 | Chinese Laser Press. All Rights Reserved 沪ICP备15018463号-20