• Spectroscopy and Spectral Analysis
  • Vol. 42, Issue 10, 3135 (2022)
Dong-feng YANG1、*, Ai-chuan LI1、1;, Jin-ming LIU1、1;, Zheng-guang CHEN1、1;, Chuang SHI1、1;, and Jun HU2、2; *;
Author Affiliations
  • 11. College of Information and Electrical Engineering, Heilongjiang Bayi Agricultural University, Daqing 163319, China
  • 22. College of Engineering, Heilongjiang Bayi Agricultural University, Daqing 163319, China
  • show less
    DOI: 10.3964/j.issn.1000-0593(2022)10-3135-08 Cite this Article
    Dong-feng YANG, Ai-chuan LI, Jin-ming LIU, Zheng-guang CHEN, Chuang SHI, Jun HU. Optimization of Seed Vigor Near-Infrared Detection by Coupling Mean Impact Value With Successive Projection Algorithm[J]. Spectroscopy and Spectral Analysis, 2022, 42(10): 3135 Copy Citation Text show less
    Near infrared spectrometer (a), Aging test box (b), Electronic scale (c) and IN312-SHD0 measuring cup (d)
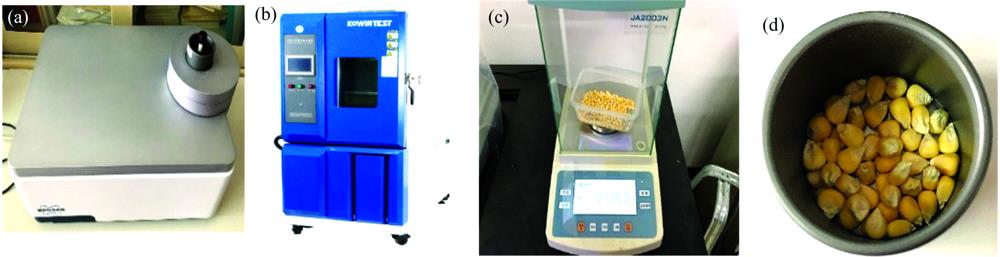
    Fig. 1. Near infrared spectrometer (a), Aging test box (b), Electronic scale (c) and IN312-SHD0 measuring cup (d)
    Spectra of 402 corn seed samples
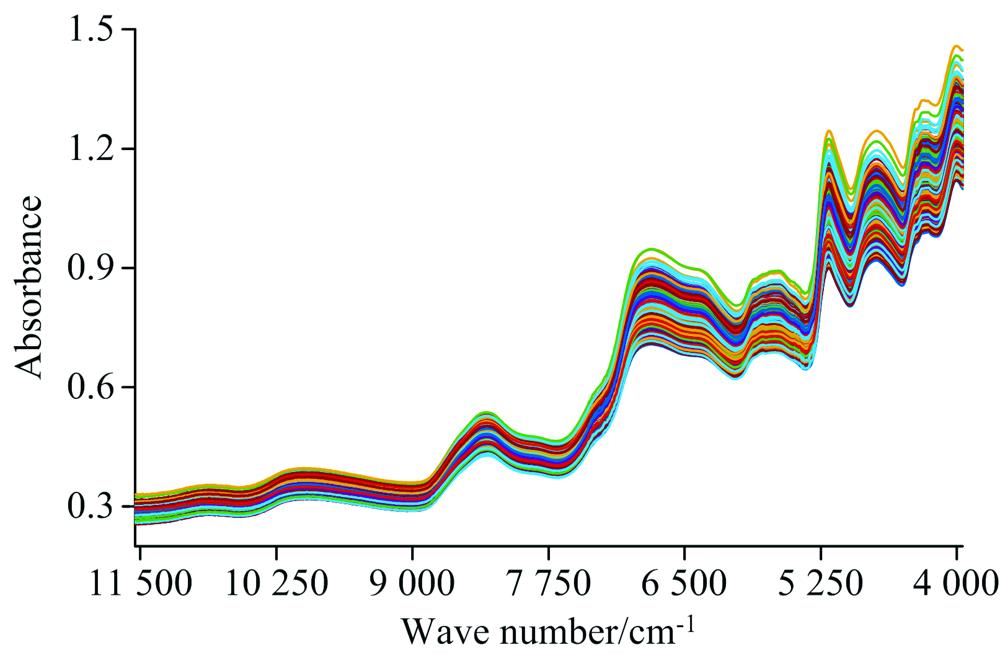
    Fig. 2. Spectra of 402 corn seed samples
    Spectra after SG-SNV pretreatment
    Fig. 3. Spectra after SG-SNV pretreatment
    Selected variables of SPA with assigning value 20 to the number of variables selected
    Fig. 4. Selected variables of SPA with assigning value 20 to the number of variables selected
    Selected variables of SPAsa (a) and the change of RMSECV with the setting number of selected variables in SPAsa (b)
    Fig. 5. Selected variables of SPAsa (a) and the change of RMSECV with the setting number of selected variables in SPAsa (b)
    Distribution of MIV values of full spectrum data
    Fig. 6. Distribution of MIV values of full spectrum data
    MIVopt pre-dimensionality reduction(a): Number of selected wavelengths varies with MIV relative distance ratio;(b): Prediction accuracy varies with MIV relative distance ratio
    Fig. 7. MIVopt pre-dimensionality reduction
    (a): Number of selected wavelengths varies with MIV relative distance ratio;(b): Prediction accuracy varies with MIV relative distance ratio
    The distribution of wavelengths selected by MIVopt-SPAsa
    Fig. 8. The distribution of wavelengths selected by MIVopt-SPAsa
    预处理方法训练集预测集
    准确率/%交叉熵准确率/%交叉熵
    GS82.140.026 376.250.031 4
    SG89.220.018 783.340.024 8
    MSC83.520.025 179.560.029 1
    SNV87.690.018 983.470.023 8
    SG-SNV92.530.013 490.180.016 2
    Table 1. Results of BP full spectrum prediction model with different pretreatment methods
    模型输入节点数隐层节点数输出层节点数运算时间/s训练准确率/%预测准确率/%最佳交叉熵
    Full-BP1 8454950.253 190.389.40.081 241
    MIV-BP64430524.52396.795.30.052 381
    SPAsa-BP46145101.22494.493.60.094 531
    MIVopt-SPAsa-BP3711514.38299.299.10.007 892
    CARS-BP17318597.22697.597.30.013 425
    Table 2. Performance comparison of 5 models
    Dong-feng YANG, Ai-chuan LI, Jin-ming LIU, Zheng-guang CHEN, Chuang SHI, Jun HU. Optimization of Seed Vigor Near-Infrared Detection by Coupling Mean Impact Value With Successive Projection Algorithm[J]. Spectroscopy and Spectral Analysis, 2022, 42(10): 3135
    Download Citation