• Photonics Research
  • Vol. 9, Issue 5, B236 (2021)
Peng Dai1、†, Yasi Wang2、†, Yueqiang Hu2, C. H. de Groot1, Otto Muskens3, Huigao Duan2、4、*, and Ruomeng Huang1、5、*
Author Affiliations
  • 1School of Electronics and Computer Science, University of Southampton, Southampton SO17 1BJ, UK
  • 2National Engineering Research Center for High Efficiency Grinding, College of Mechanical and Vehicle Engineering, Hunan University, Changsha 410082, China
  • 3School of Physics and Astronomy, University of Southampton, Southampton SO17 1BJ, UK
  • 4e-mail: duanhg@hnu.edu.cn
  • 5e-mail: r.huang@soton.ac.uk
  • show less
    DOI: 10.1364/PRJ.415141 Cite this Article Set citation alerts
    Peng Dai, Yasi Wang, Yueqiang Hu, C. H. de Groot, Otto Muskens, Huigao Duan, Ruomeng Huang. Accurate inverse design of Fabry–Perot-cavity-based color filters far beyond sRGB via a bidirectional artificial neural network[J]. Photonics Research, 2021, 9(5): B236 Copy Citation Text show less
    (a) Schematic illustration of a transmissive F-P-cavity-based color filter with an MIM structure. (b) The training and validation dataset generated by the F-P cavity plotted in a CIE 1931-xy chromaticity diagram. The red triangle depicts the boundary of sRGB color space for a guide of the eye. (c) The original 1000 testing data and (d) the 7000 uniformly distributed testing data plotted in the CIE 1931-xy chromaticity diagram.
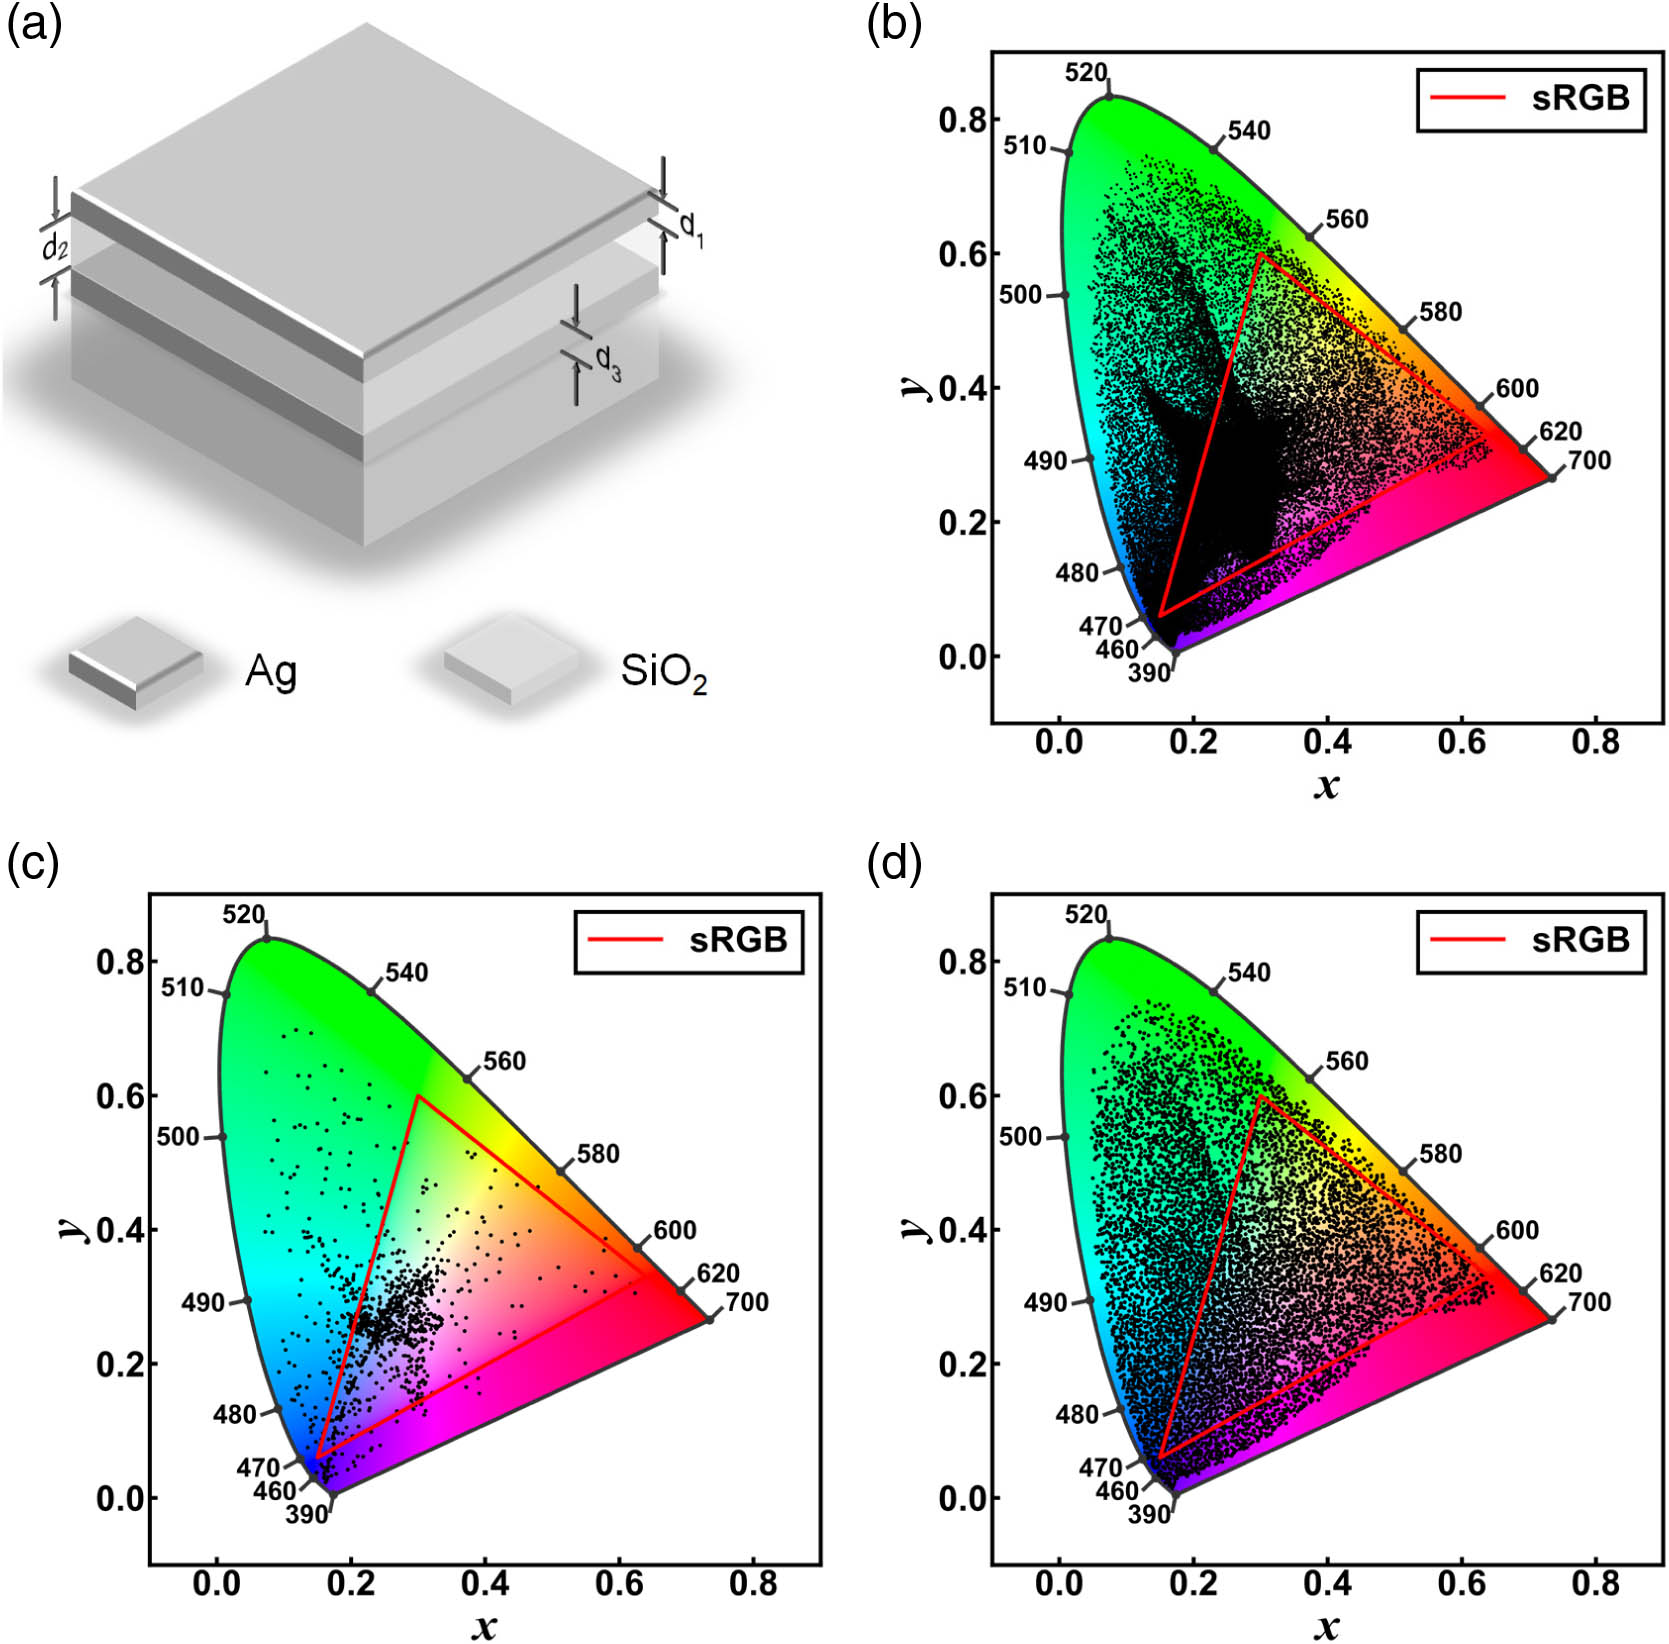
    Fig. 1. (a) Schematic illustration of a transmissive F-P-cavity-based color filter with an MIM structure. (b) The training and validation dataset generated by the F-P cavity plotted in a CIE 1931-xy chromaticity diagram. The red triangle depicts the boundary of sRGB color space for a guide of the eye. (c) The original 1000 testing data and (d) the 7000 uniformly distributed testing data plotted in the CIE 1931-xy chromaticity diagram.
    Forward neural network for predicting F-P cavity structural colors. (a) The relationships of different parameters in the dataset. The single arrow means the transformation is unidirectional, the double arrow means the transformation is reversible. (b) The architecture of the forward neural network with input layer of geometric parameter D, hidden layers, and output layers of Lab color values.
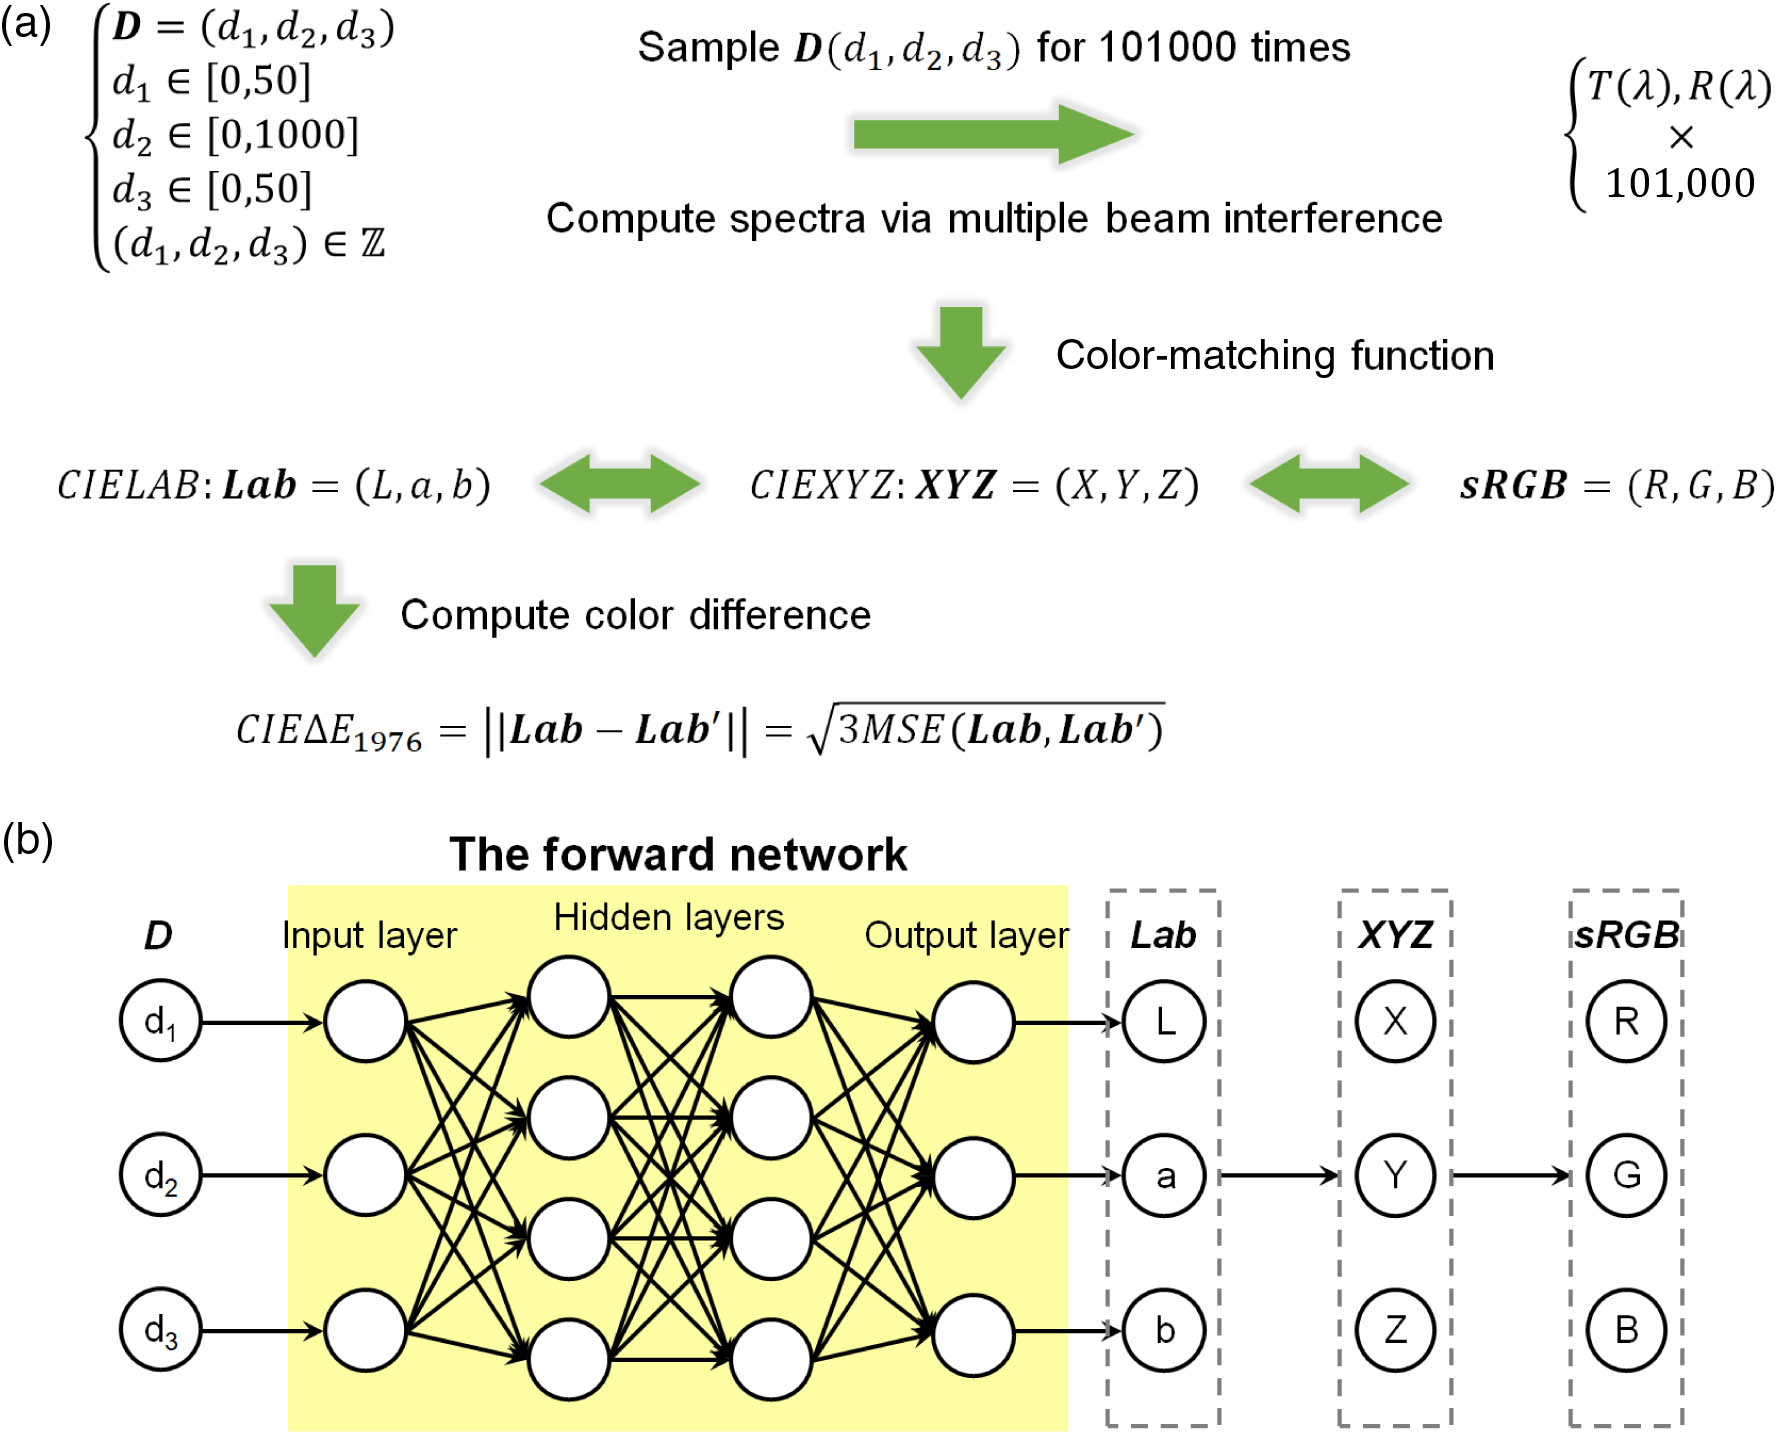
    Fig. 2. Forward neural network for predicting F-P cavity structural colors. (a) The relationships of different parameters in the dataset. The single arrow means the transformation is unidirectional, the double arrow means the transformation is reversible. (b) The architecture of the forward neural network with input layer of geometric parameter D, hidden layers, and output layers of Lab color values.
    Forward neural network training for predicting F-P cavity structural colors. The histogram of the probability and average values of ΔE2000 of the FNNs with different (a) hidden layer number, (b) neuron number per layer, and (c) the FNN with seven hidden layers and 250 neurons in each hidden layer for different dataset size. (d) The training loss curves for defining the loss function in CIE 1931-XYZ and CIE 1976-Lab color spaces. (e) The probability histogram and average values of ΔE2000 comparisons while the loss function is defined in CIE 1931-XYZ color space and CIE 1976-Lab color space. (f) The selected colors in the CIE 1931-xy chromaticity diagram with the boundary of each ellipse representing the colors that have a ΔE1976 of 6 to the selected color.
    Fig. 3. Forward neural network training for predicting F-P cavity structural colors. The histogram of the probability and average values of ΔE2000 of the FNNs with different (a) hidden layer number, (b) neuron number per layer, and (c) the FNN with seven hidden layers and 250 neurons in each hidden layer for different dataset size. (d) The training loss curves for defining the loss function in CIE 1931-XYZ and CIE 1976-Lab color spaces. (e) The probability histogram and average values of ΔE2000 comparisons while the loss function is defined in CIE 1931-XYZ color space and CIE 1976-Lab color space. (f) The selected colors in the CIE 1931-xy chromaticity diagram with the boundary of each ellipse representing the colors that have a ΔE1976 of 6 to the selected color.
    Inverse neural network for predicting F-P cavity structural colors. (a) The bidirectional architecture with input layer of Lab values and output layer of geometric parameter D and connected to the pretrained forward neural network. (b) The schematic of different weights’ initialization positions. (c) The loss surface schematics of nonuniqueness (left) and uniqueness (right) problems, respectively. The MSEs after 200 epochs as a function of random seed, the training loss curves, the histogram of the distribution, and average values of ΔE2000 of the INNs with (d)–(f) different numbers of hidden layers and (g)–(i) different numbers of neurons per layer.
    Fig. 4. Inverse neural network for predicting F-P cavity structural colors. (a) The bidirectional architecture with input layer of Lab values and output layer of geometric parameter D and connected to the pretrained forward neural network. (b) The schematic of different weights’ initialization positions. (c) The loss surface schematics of nonuniqueness (left) and uniqueness (right) problems, respectively. The MSEs after 200 epochs as a function of random seed, the training loss curves, the histogram of the distribution, and average values of ΔE2000 of the INNs with (d)–(f) different numbers of hidden layers and (g)–(i) different numbers of neurons per layer.
    Actual application of the INN-based structural color design. (a) The origin and (b) the reproduction via INN of the painting “Haystacks, end of Summer” by Claude Monet. Reproduction of “Haystacks, end of Summer” is permitted by the Musée d’Orsay, Paris (RF 1975 3).
    Fig. 5. Actual application of the INN-based structural color design. (a) The origin and (b) the reproduction via INN of the painting “Haystacks, end of Summer” by Claude Monet. Reproduction of “Haystacks, end of Summer” is permitted by the Musée d’Orsay, Paris (RF 1975 3).
    Transmissive spectra and corresponding CIE 1931-RGB tristimulus values for the designed colors. The transmissive spectra (black line) and the contribution from the three stimuli (shades underneath the line) for the (i, ii, iii) blue, (iv, v, vi) green, and (vii, viii, ix) red color designed by the INN in this work. Within each figure, the middle row figure presents the original design, while the top and bottom figures represent the spectra from a 10 nm thinner layer and a 10 nm thicker dielectric layer. (b) The CIE 1931-RGB tristimulus values as a function of dielectric layer thickness for the blue, green, and red colors, respectively. The CIE 1931-RGB tristimulus values of the targeted colors are also included (dotted lines) for comparison.
    Fig. 6. Transmissive spectra and corresponding CIE 1931-RGB tristimulus values for the designed colors. The transmissive spectra (black line) and the contribution from the three stimuli (shades underneath the line) for the (i, ii, iii) blue, (iv, v, vi) green, and (vii, viii, ix) red color designed by the INN in this work. Within each figure, the middle row figure presents the original design, while the top and bottom figures represent the spectra from a 10 nm thinner layer and a 10 nm thicker dielectric layer. (b) The CIE 1931-RGB tristimulus values as a function of dielectric layer thickness for the blue, green, and red colors, respectively. The CIE 1931-RGB tristimulus values of the targeted colors are also included (dotted lines) for comparison.
    Table 1. Comparison of the Six Randomly Selected Target Structure D, Lab, and sRGB Color Values with the Corresponding Values Inversely Designed by the Inverse Neural Network
    Peng Dai, Yasi Wang, Yueqiang Hu, C. H. de Groot, Otto Muskens, Huigao Duan, Ruomeng Huang. Accurate inverse design of Fabry–Perot-cavity-based color filters far beyond sRGB via a bidirectional artificial neural network[J]. Photonics Research, 2021, 9(5): B236
    Download Citation