• Acta Optica Sinica
  • Vol. 37, Issue 12, 1215005 (2017)
Feng Liu1、*, Tongsheng Shen2, Shuli Lou1, and Bing Han3
Author Affiliations
  • 1 Department of Control Engineering, Naval Aeronautical and Astronautical University, Yantai, Shandong 264001, China
  • 2 China Defense Science and Technology Information Center, Beijing 100142, China
  • 3 Element 98 of Unit 92493, PLA, Huludao, Liaoning 125000, China
  • show less
    DOI: 10.3788/AOS201737.1215005 Cite this Article Set citation alerts
    Feng Liu, Tongsheng Shen, Shuli Lou, Bing Han. Deep Network Saliency Detection Based on Global Model and Local Optimization[J]. Acta Optica Sinica, 2017, 37(12): 1215005 Copy Citation Text show less
    Structure of model
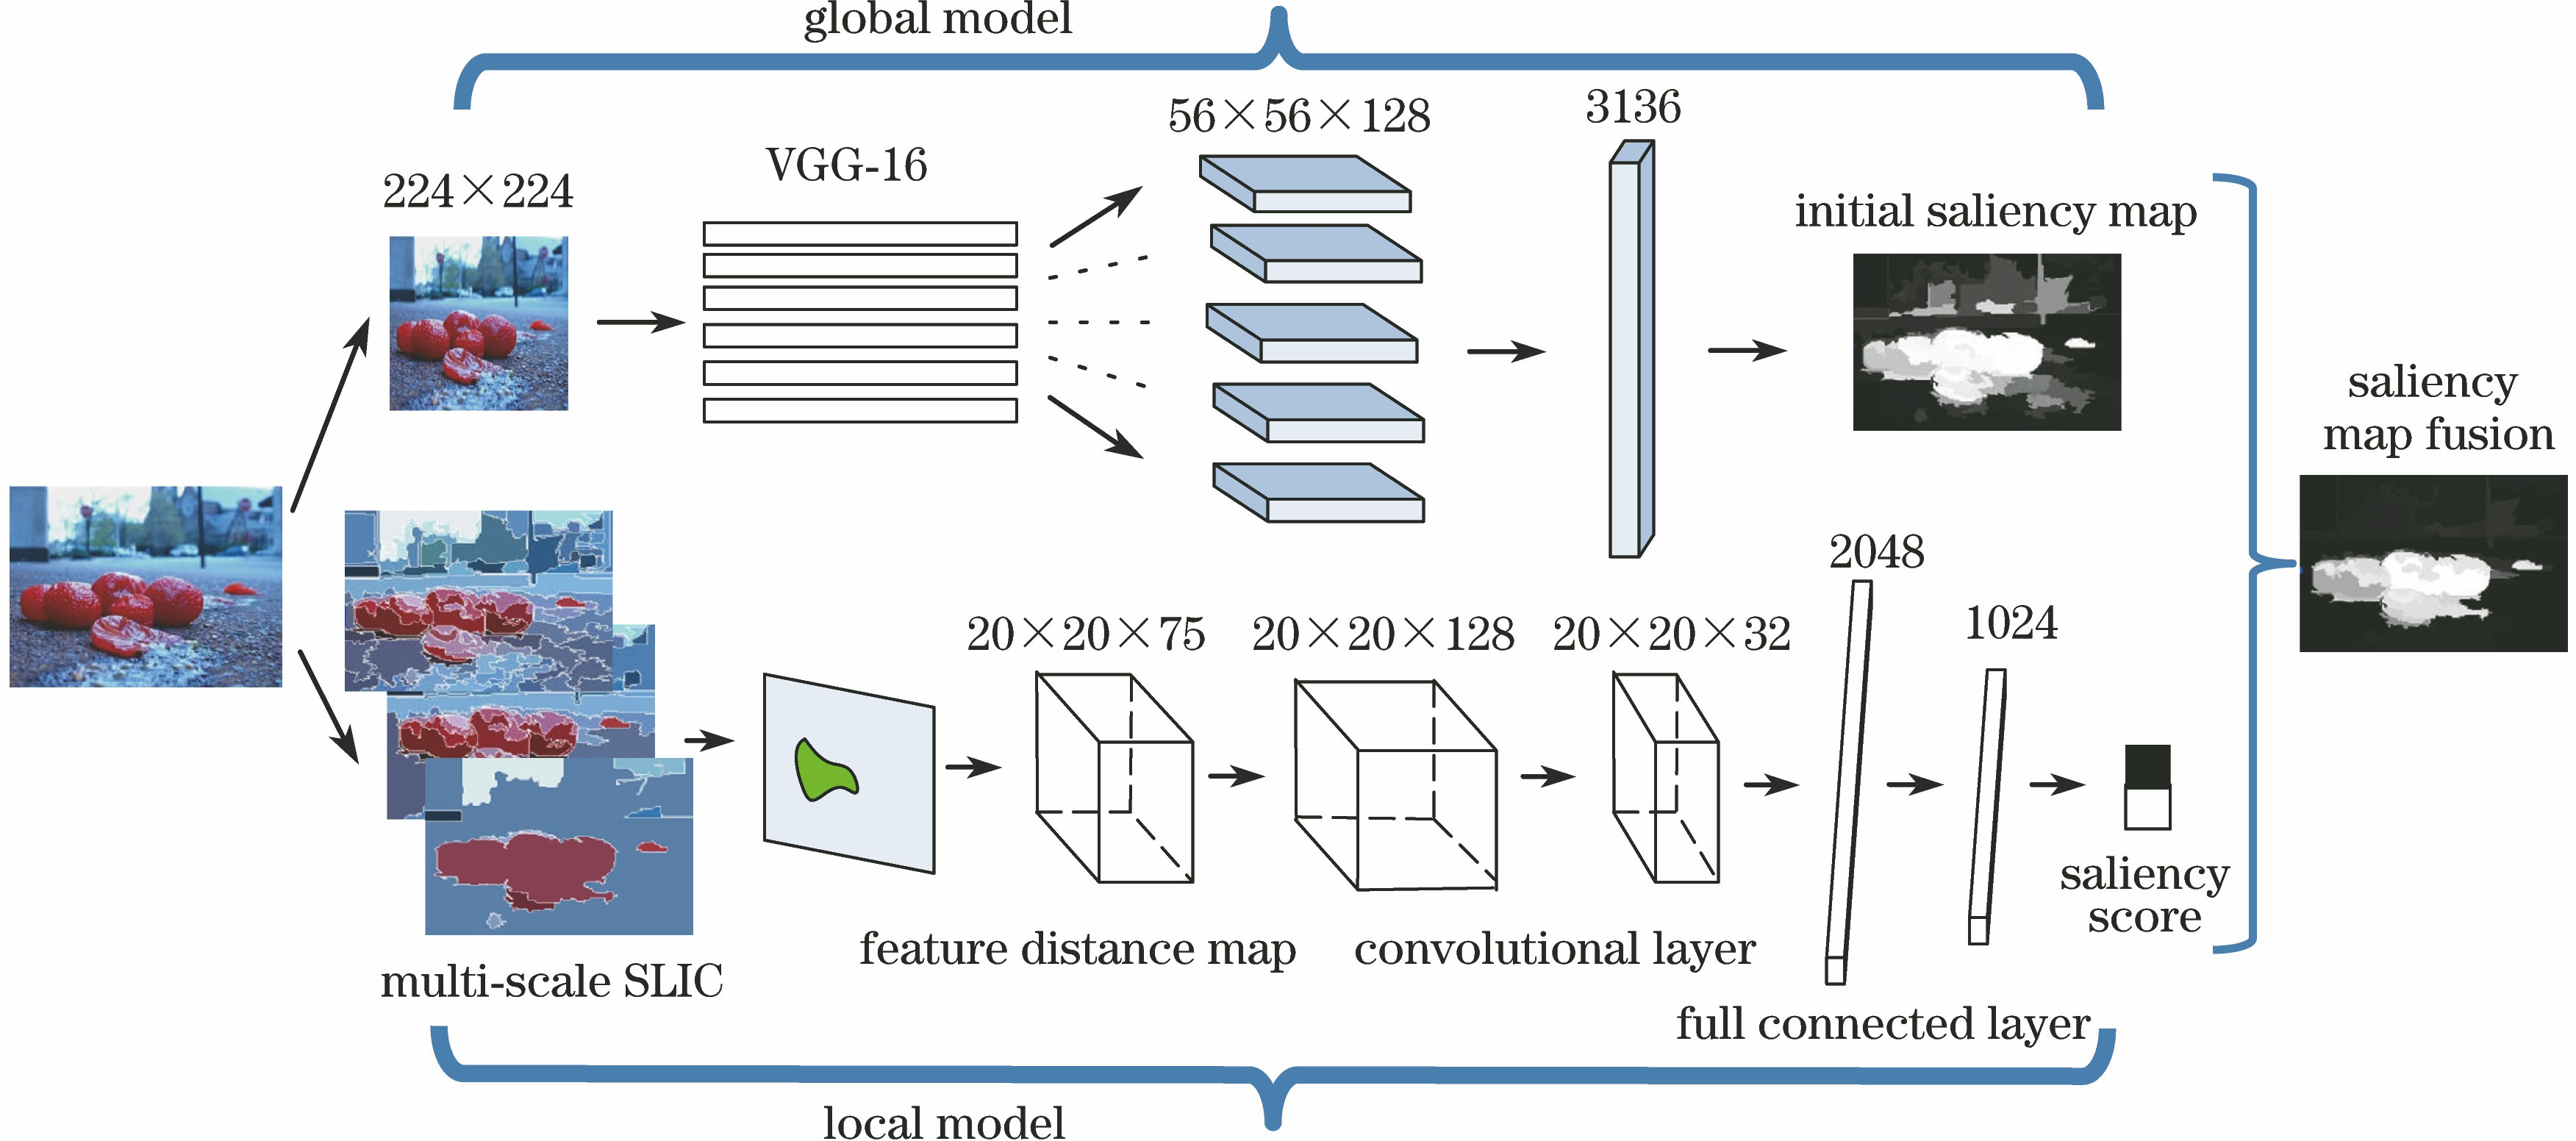
    Fig. 1. Structure of model
    Network structure of global model
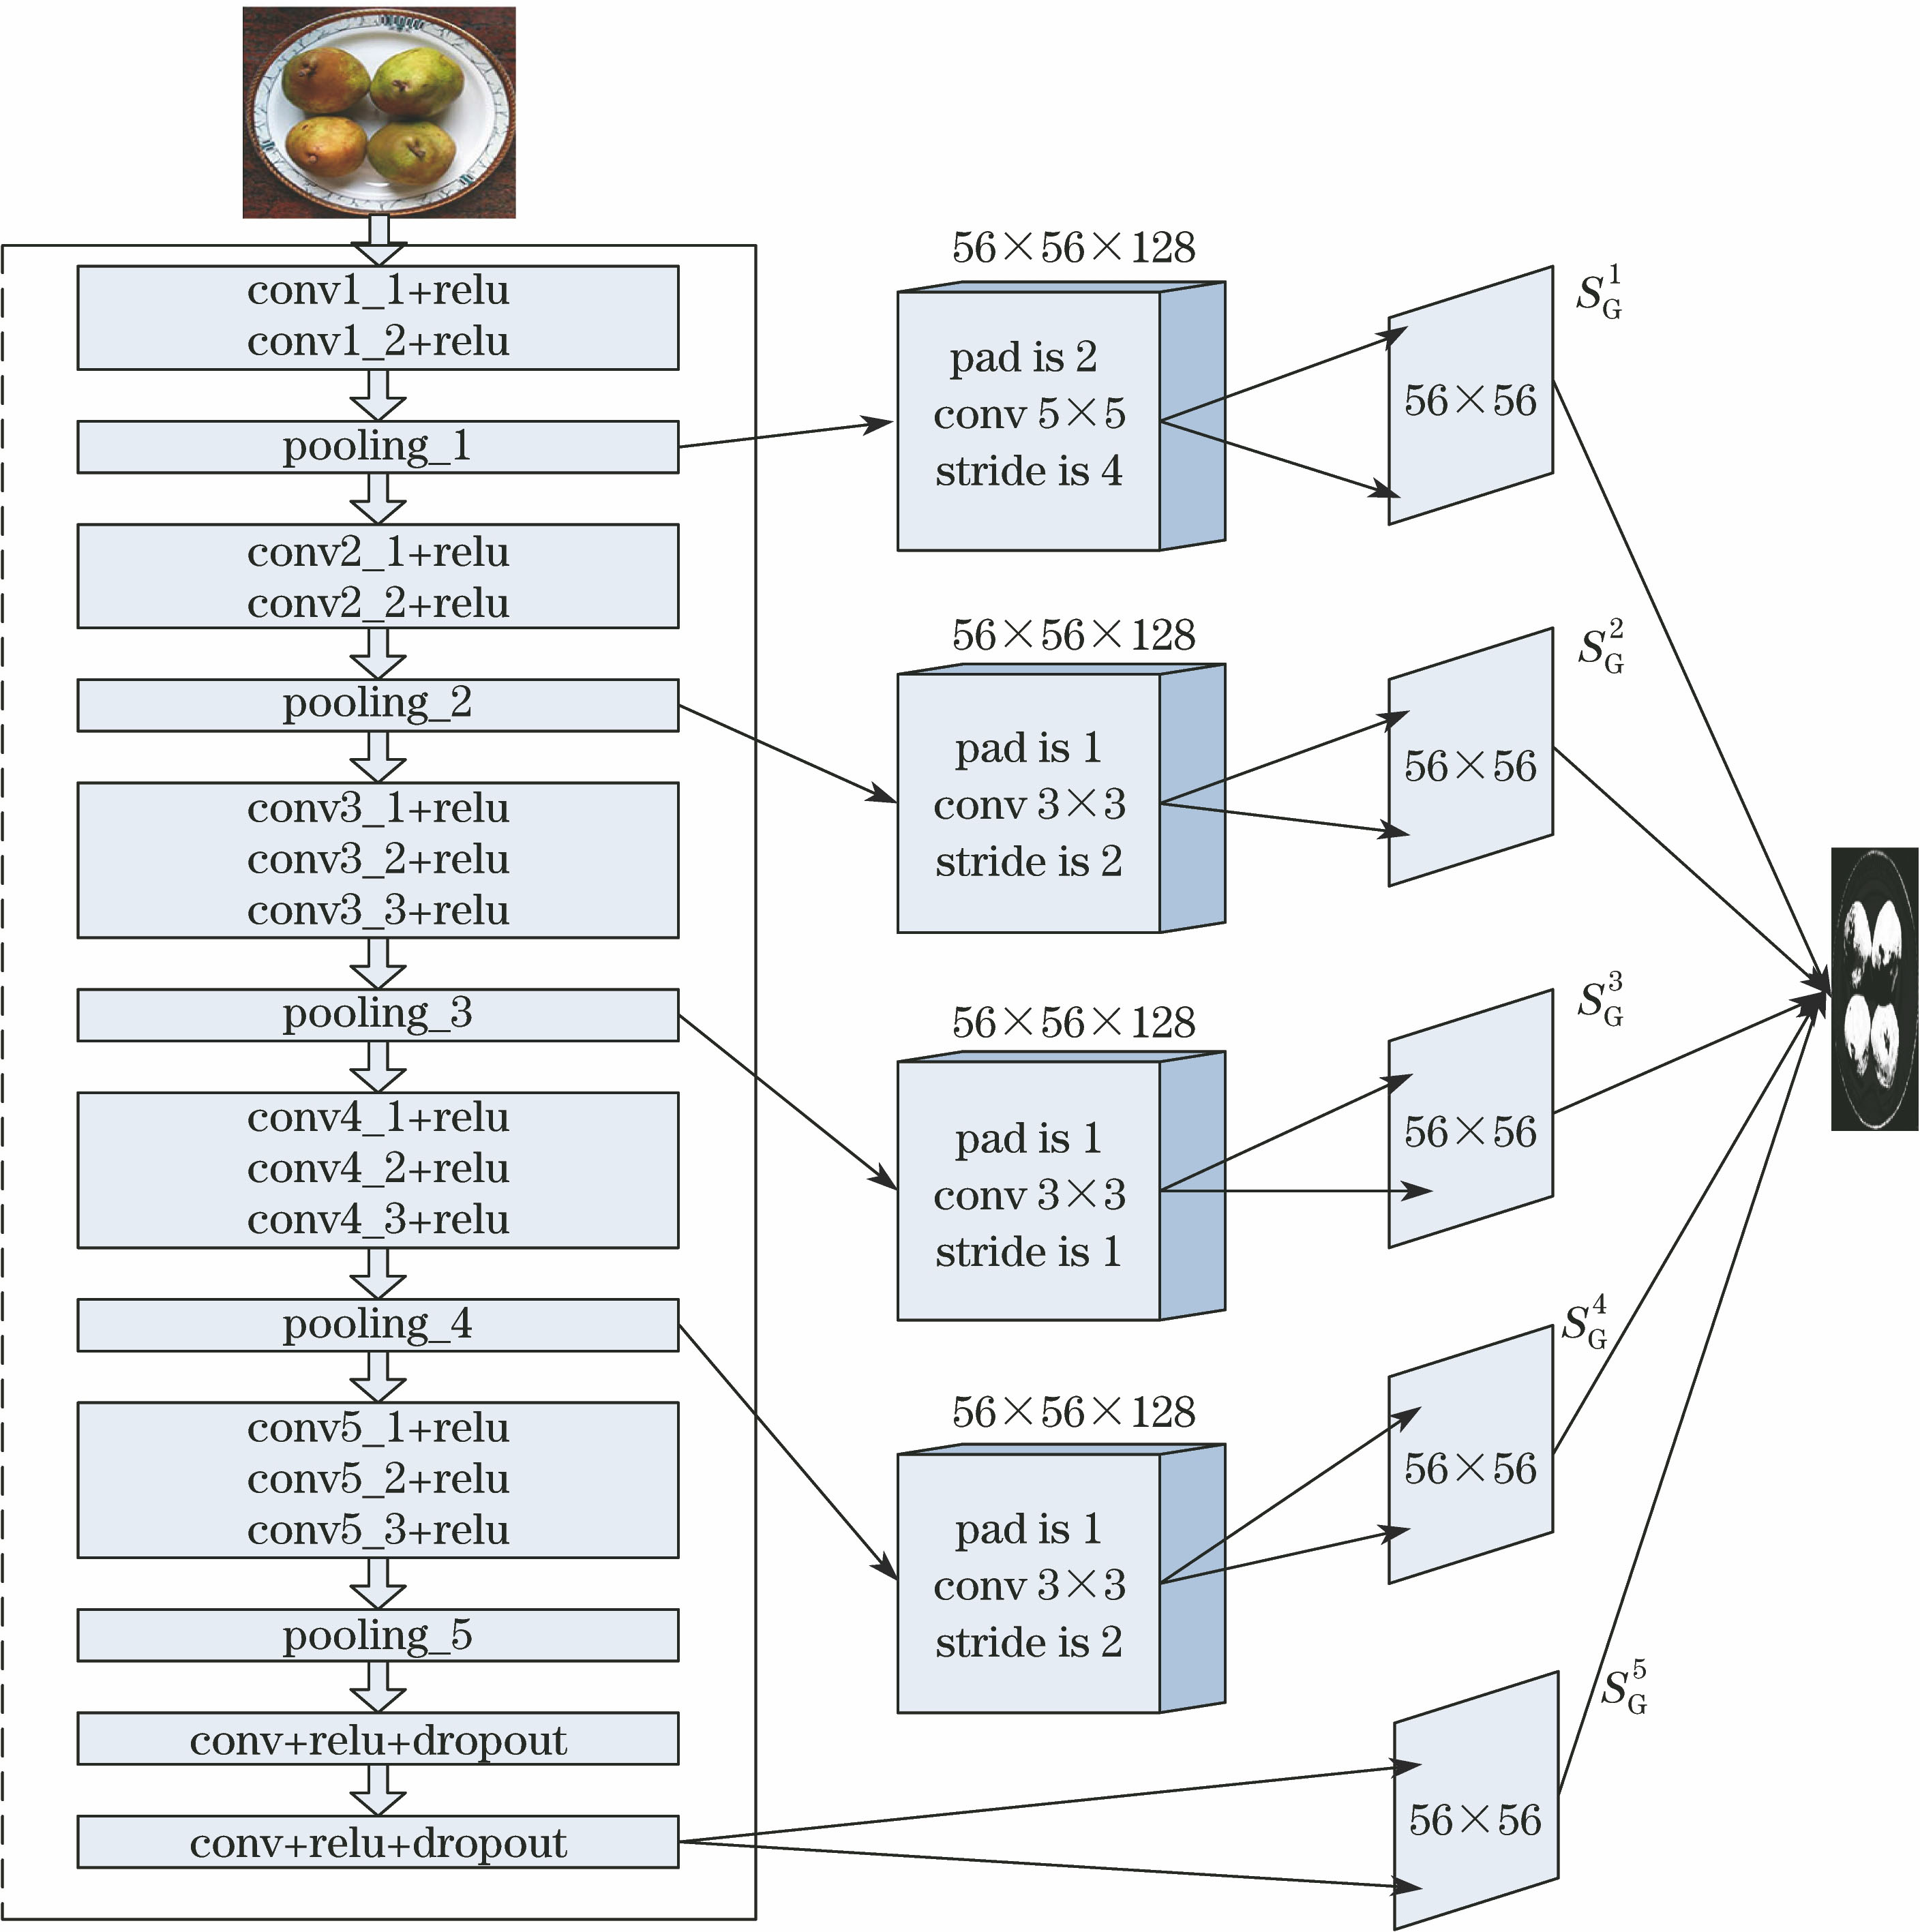
    Fig. 2. Network structure of global model
    Generation of feature vectors of super-pixel
    Fig. 3. Generation of feature vectors of super-pixel
    Saliency maps of different steps. (a) Original images; (b) global models; (c) images of local optimization; (d) final saliency maps; (e) ground truth images
    Fig. 4. Saliency maps of different steps. (a) Original images; (b) global models; (c) images of local optimization; (d) final saliency maps; (e) ground truth images
    PR curves of four data sets with different methods. (a) SOD; (b) PASCAL-S; (c) CSSD; (d) MSRA
    Fig. 5. PR curves of four data sets with different methods. (a) SOD; (b) PASCAL-S; (c) CSSD; (d) MSRA
    Visual comparisons of our results and others. (a) Original images; (b) ground truth images; (c) proposed method; (d) LEGS; (e) DRFI; (f) HDCT; (g) wCtr; (h) PCA; (i) GBVS
    Fig. 6. Visual comparisons of our results and others. (a) Original images; (b) ground truth images; (c) proposed method; (d) LEGS; (e) DRFI; (f) HDCT; (g) wCtr; (h) PCA; (i) GBVS
    Color texture featureDifferential feature
    FeatureDescriptorDimensionDefinitionDimension
    Average RGB valuea13d(aR1,a1I)3
    Average lab valuea23d(aR2,aI2)3
    Gabor filter responser24d(rR,rI)24
    Maximum Gabor responser1d(rR,rI)1
    RGB color histogramh124χ2(hR1,hI1)1
    Lab color histogramh224χ2(hR2,hI2)1
    HSV color histogramh324χ2(hR3,hI3)1
    Table 1. Feature vectors of contrast descriptor
    FeatureDimensionFeatureDimension
    Normalized x of regional center1Regional connectivity[16]1
    Normalized y of regional center1RGB color variance3
    Normalized are1Lab color variance3
    Aspect ratio of bounding box1HSV color variance3
    Bounding box width1Gabor filter response variance24
    Bounding box length1Normalized area of neighborhood1
    Table 2. Parameters of regional feature descriptor
    DatasetCurveProposed methodLEGS methodDRFI methodHDCT methodwCtr methodGBVS methodPCA methodGC methodSF methodMR method
    SODF-measure73.167.470.265.463.761.354.950.655.354.2
    MAE20.421.224.126.624.526.925.328.826.727.4
    CSSDF-measure84.683.178.870.566.865.357.555.754.567.5
    MAE12.811.917.919.918.422.725.223.420.119.0
    PASCALF-measure75.374.969.960.461.169.353.161.657.458.3
    MAE14.715.520.322.920.117.823.925.521.421.2
    MSRAF-measure91.290.591.980.578.365.970.168.262.578.3
    MAE10.48.914.311.916.613.718.914.716.213.0
    Table 3. Comparison of F-measure scores with different methods%
    Feng Liu, Tongsheng Shen, Shuli Lou, Bing Han. Deep Network Saliency Detection Based on Global Model and Local Optimization[J]. Acta Optica Sinica, 2017, 37(12): 1215005
    Download Citation