• Advanced Photonics
  • Vol. 4, Issue 4, 046003 (2022)
Bo Jiang1, Song Zhu1、2, Linhao Ren1, Lei Shi1、3、*, and Xinliang Zhang1、3
Author Affiliations
  • 1Huazhong University of Science and Technology, Wuhan National Laboratory for Optoelectronics, Wuhan, China
  • 2Nanyang Technological University, School of Electrical and Electronic Engineering, Singapore
  • 3Optics Valley Laboratory, Wuhan, China
  • show less
    DOI: 10.1117/1.AP.4.4.046003 Cite this Article Set citation alerts
    Bo Jiang, Song Zhu, Linhao Ren, Lei Shi, Xinliang Zhang. Simultaneous ultraviolet, visible, and near-infrared continuous-wave lasing in a rare-earth-doped microcavity[J]. Advanced Photonics, 2022, 4(4): 046003 Copy Citation Text show less
    Simultaneous ultraviolet, visible, and near-infrared CW lasing at room temperature. (a) Schematic of ultraviolet, visible, and near-infrared lasing by an Er-Yb co-doped microsphere under 975-nm CW laser excitation. Inset: Optical image of an Er-Yb co-doped microsphere with a diameter of 57 μm under a 4-mW pump. (b) Total optical loss evolution over six FSRs, including the theoretical Er-induced absorption loss and the intrinsic loss of the Er-Yb co-doped microsphere. Inset: Scanning electron microscopy image of the microsphere. (c) Experimental setup. VOA, variable optical attenuator; PM, power meter; PC, polarization controller; WDM, wavelength division multiplexer; OSA, optical spectrum analyzer; OS, optical switch; OBSF, 975-nm optical band-stop filter; DSO, digital storage oscilloscope; TDL, tunable diode laser; AWG, arbitrary waveform generator; PD, photodetector.
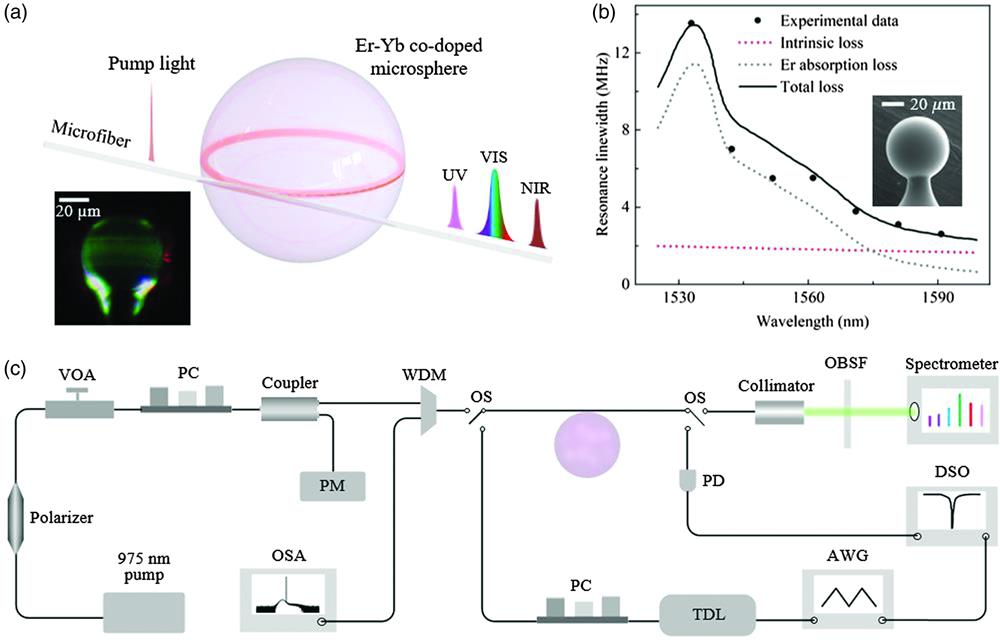
    Fig. 1. Simultaneous ultraviolet, visible, and near-infrared CW lasing at room temperature. (a) Schematic of ultraviolet, visible, and near-infrared lasing by an Er-Yb co-doped microsphere under 975-nm CW laser excitation. Inset: Optical image of an Er-Yb co-doped microsphere with a diameter of 57  μm under a 4-mW pump. (b) Total optical loss evolution over six FSRs, including the theoretical Er-induced absorption loss and the intrinsic loss of the Er-Yb co-doped microsphere. Inset: Scanning electron microscopy image of the microsphere. (c) Experimental setup. VOA, variable optical attenuator; PM, power meter; PC, polarization controller; WDM, wavelength division multiplexer; OSA, optical spectrum analyzer; OS, optical switch; OBSF, 975-nm optical band-stop filter; DSO, digital storage oscilloscope; TDL, tunable diode laser; AWG, arbitrary waveform generator; PD, photodetector.
    Energy level diagram and proposed light emission mechanisms. The dashed and dotted arrows represent ET and multiphoton relaxation processes, respectively. The upward full arrows represent the upward transition induced by photon excitation or the ET process. The downward full arrows represent the downward transition induced by photon emission or the ET process.
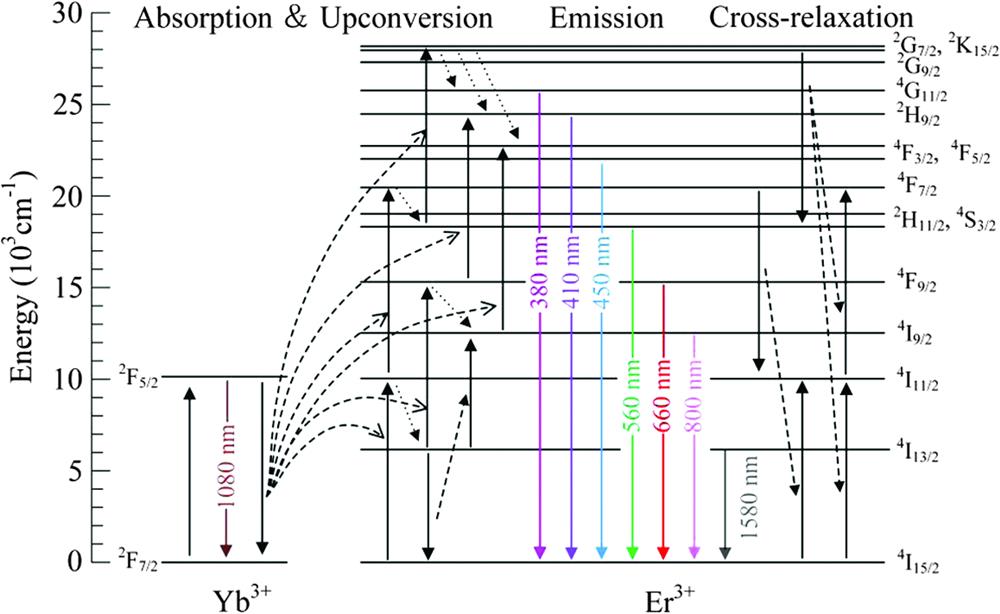
    Fig. 2. Energy level diagram and proposed light emission mechanisms. The dashed and dotted arrows represent ET and multiphoton relaxation processes, respectively. The upward full arrows represent the upward transition induced by photon excitation or the ET process. The downward full arrows represent the downward transition induced by photon emission or the ET process.
    Thresholds and polarization characteristics of ultraviolet, visible, and near-infrared CW lasing. The emission intensity versus the pump power in log–log scale, where S represents the slope. Inset: The emission intensity as a function of the polarization angle. The upconversion emission intensities are integrated from (a) 380 to 396 nm and 402 to 426 nm, (b) 450 to 489 nm and 756 to 816 nm, (c) 555 to 575 nm and 645 to 590 nm. (d) The downshifting emission intensities are summarized from the intensities of individual lasing wavelengths.
    Fig. 3. Thresholds and polarization characteristics of ultraviolet, visible, and near-infrared CW lasing. The emission intensity versus the pump power in log–log scale, where S represents the slope. Inset: The emission intensity as a function of the polarization angle. The upconversion emission intensities are integrated from (a) 380 to 396 nm and 402 to 426 nm, (b) 450 to 489 nm and 756 to 816 nm, (c) 555 to 575 nm and 645 to 590 nm. (d) The downshifting emission intensities are summarized from the intensities of individual lasing wavelengths.
    Lasing spectrum evolution with the increased pump power. The lasing spectra (black line) from 350 to 835 nm are acquired by the spectrometer. The lasing spectra (blue line) from 1040 to 1090 nm and 1525 to 1590 nm are acquired by the OSA. The pump powers are (a) 3, (b) 36, (c) 100, and (d) 1100 μW, respectively, from the bottom to the top. The insets are the zoom-in lasing spectra.
    Fig. 4. Lasing spectrum evolution with the increased pump power. The lasing spectra (black line) from 350 to 835 nm are acquired by the spectrometer. The lasing spectra (blue line) from 1040 to 1090 nm and 1525 to 1590 nm are acquired by the OSA. The pump powers are (a) 3, (b) 36, (c) 100, and (d) 1100  μW, respectively, from the bottom to the top. The insets are the zoom-in lasing spectra.
    Lasing stability. (a) Lasing intensity and (b) wavelength evolution over the duration of 190 min, exhibiting stable emission intensities and slight wavelength drifts.
    Fig. 5. Lasing stability. (a) Lasing intensity and (b) wavelength evolution over the duration of 190 min, exhibiting stable emission intensities and slight wavelength drifts.
    Bo Jiang, Song Zhu, Linhao Ren, Lei Shi, Xinliang Zhang. Simultaneous ultraviolet, visible, and near-infrared continuous-wave lasing in a rare-earth-doped microcavity[J]. Advanced Photonics, 2022, 4(4): 046003
    Download Citation