• Spectroscopy and Spectral Analysis
  • Vol. 41, Issue 10, 3262 (2021)
Guo-shui WANG1、*, Ao GUO2、2;, Xiao-nan LIU1、1;, Lei FENG1、1;, Peng-hao CHANG1、1;, Li-ming ZHANG1、1;, Long LIU1、1;, and Xiao-tao YANG1、1; *;
Author Affiliations
  • 11. School of Power and Energy Engineering, Harbin Engineering University, Harbin 150000, China
  • 22. School of Physics and Optoelectronic Engineering, Harbin Engineering University, Harbin 150000, China
  • show less
    DOI: 10.3964/j.issn.1000-0593(2021)10-3262-07 Cite this Article
    Guo-shui WANG, Ao GUO, Xiao-nan LIU, Lei FENG, Peng-hao CHANG, Li-ming ZHANG, Long LIU, Xiao-tao YANG. Simulation and Influencing Factors Analysis of Gas Detection System Based on TDLAS Technology[J]. Spectroscopy and Spectral Analysis, 2021, 41(10): 3262 Copy Citation Text show less
    Wave number variation of modulated laser
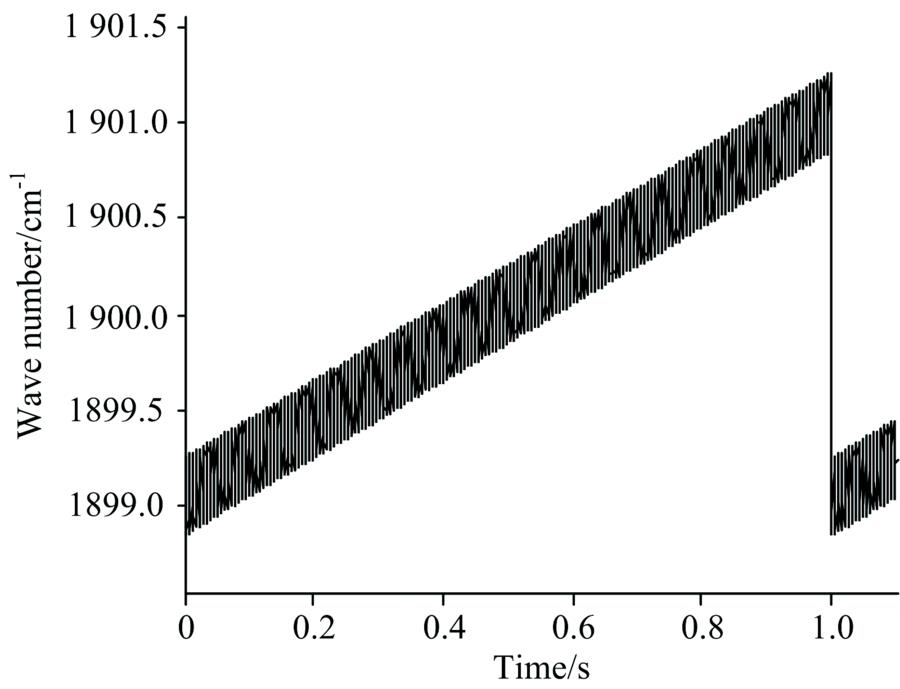
    Fig. 1. Wave number variation of modulated laser
    The light intensity after being absorbed by the air chamber
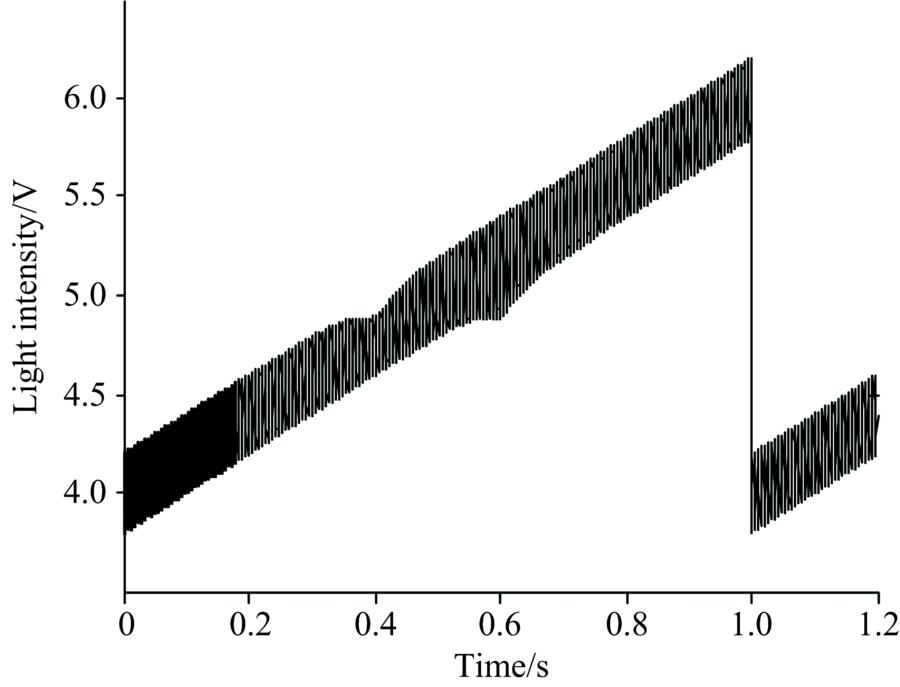
    Fig. 2. The light intensity after being absorbed by the air chamber
    The X and Y filtering components of the second harmonic
    Fig. 3. The X and Y filtering components of the second harmonic
    The X and Y filtering components of the first harmonic
    Fig. 3. The X and Y filtering components of the first harmonic
    S2f/1f signal
    Fig. 4. S2f/1f signal
    Concentration-signal peak fitting curve
    Fig. 5. Concentration-signal peak fitting curve
    Second harmonic at different pressures
    Fig. 6. Second harmonic at different pressures
    Second harmonic at different temperatures
    Fig. 7. Second harmonic at different temperatures
    Second harmonic at different modulation factors
    Fig. 8. Second harmonic at different modulation factors
    Fitting curve of modulation factors and second harmonic peak
    Fig. 9. Fitting curve of modulation factors and second harmonic peak
    Second harmonic at different modulation frequencies
    Fig. 10. Second harmonic at different modulation frequencies
    频率/cm-1S(T0)/(cm·mol-1)
    1 900.081 642.027×10⁻²⁰
    1 900.070 582.028×10⁻²⁰
    1 900.070 592.322×10⁻²⁰
    1 900.081 592.322×10⁻²⁰
    1 900.081 631.768×10⁻²⁰
    1 900.070 601.770×10⁻²⁰
    Table 1. The date of line strength
    浓度/(×10-6)信号峰值/V
    04.517 2×10⁻⁴
    500.083 3
    1000.165 2
    1500.245 4
    2000.324 1
    2500.401 1
    3000.476 7
    3500.550 7
    4000.623 3
    4500.694 4
    5000.764 1
    Table 2. Signal peaks corresponding to different concentrations (volume fraction)
    设定的气体
    浓度/10-6
    反演得到的气体
    浓度/10-6
    误差百分比
    /%
    8079.173 61.03
    120121.631.36
    160163.415 62.13
    200204.524 42.49
    240244.975 32.07
    280284.780 41.72
    320323.950 61.23
    360362.496 80.69
    400400.429 80.11
    440437.759 10.51
    480474.494 31.15
    Table 3. Measurement of gas concentration (volume fraction) and its error
    设定的气体
    浓度/10-6
    反演得到的气体
    浓度/10-6
    误差百分比
    /%
    5049.930.14
    100100.000.00
    150149.660.23
    200198.910.55
    300296.201.27
    Table 4. Measurement of gas concentration (volume fraction) and its error
    Guo-shui WANG, Ao GUO, Xiao-nan LIU, Lei FENG, Peng-hao CHANG, Li-ming ZHANG, Long LIU, Xiao-tao YANG. Simulation and Influencing Factors Analysis of Gas Detection System Based on TDLAS Technology[J]. Spectroscopy and Spectral Analysis, 2021, 41(10): 3262
    Download Citation