 AI Video Guide
  AI Picture Guide
 AI One Sentence

Zhen Liu, Lucheng Yuan, Jie Tang, Yunpeng Zhang, Jiqiao Liu, Xiaopeng Zhu, Juxin Yang, Wei Shi, Weibiao Chen, "Coherent Doppler lidar wind retrieval for a typhoon based on the genetic simulated annealing algorithm," Chin. Opt. Lett. 22, 040101 (2024)
- Chinese Optics Letters
- Vol. 22, Issue 4, 040101 (2024)
Note: This section is automatically generated by AI . The website and platform operators shall not be liable for any commercial or legal consequences arising from your use of AI generated content on this website. Please be aware of this.
Abstract
Keywords
1. Introduction
Typhoons, a category of tropical cyclones, account for over a third of all tropical cyclone occurrences in the Northern Hemisphere[1]. From 2000 to 2009, the Northwest Pacific experienced 239 typhoons, while 79 occurred in the South China Sea[2]. In recent years, typhoons have frequently made landfall in East Asia, causing significant property damage and loss of life in coastal regions[3]. China ranks among the countries most adversely affected by typhoons in the Western Pacific, experiencing an average of 9.3 typhoon landfalls annually[4,5]. Therefore, it is crucial for disaster mitigation to accurately obtain wind speed and direction during a typhoon.
Coherent Doppler lidar (CDL) efficiently detects atmospheric wind profiles from the earth’s surface up to the boundary layer, offering advantages such as high temporal-spatial resolution, superior precision, and robust interference resistance[6-9]. The CDL receives backscattered signals from aerosols. The lidar receiver system mixes the signal with the local oscillation (LO) light to obtain the Doppler velocity spectrum caused by the wind field[10]. Radial wind field information at different azimuth angles can be obtained by employing a scanner. Finally, the three-dimensional (3D) wind field is calculated by the retrieval algorithm[11].
Depending on the algorithm’s processing target, 3D wind field retrieval algorithms can be broadly categorized into two types: those based on radial wind speed such as the least square method (LSM)[12-14] and those based on spectrum estimation[15]. The retrieval algorithms based on radial wind speed require radial wind speed information, resulting in the retrieval accuracy of the algorithm being heavily dependent on the measurement accuracy of radial wind speed. These algorithms perform poorly when the carried-to-noise ratio (CNR) is low. However, spectrum estimation methods do not require radial wind speed information. Instead, they leverage the correlations among Doppler velocity spectra in different azimuths, enabling the retrieval of 3D wind field from weak signals. In 2019, the French Aerospace Lab (ONERA) developed an airborne CDL system named LIVE, which employed spectral estimation for retrieval[16]. It retrieved wind vector information effectively. In 2020, Yuan et al. proposed a retrieval method of spectrum estimation based on the genetic algorithm (GA) to retrieve the 3D wind field, which was applied in the multi-azimuth, stationary, staring CDL developed by the Shanghai Institute of Optics and Fine Mechanics (SIOM)[17]. This method demonstrated superior global optimization capabilities and produced more accurate retrieval results. In 2023, Zhao et al. used a spectrum estimation method based on the GA to realize the 3D wind field retrieval of airborne flight data in the ground coordinate system after the attitude correction and height matching of the retrieval data[18]. However, the low computational efficiency of the genetic algorithm remains a challenge for real-time data processing.
Sign up for Chinese Optics Letters TOC. Get the latest issue of Chinese Optics Letters delivered right to you!Sign up now
To improve the speed of the algorithm, we propose a retrieval method of spectrum estimation based on the genetic simulated annealing (GSA) algorithm to retrieve coherent Doppler lidar 3D wind field. Compared to the GA, the GSA algorithm can not only improve the detection distance but also accelerate the retrieval speed. To validate the retrieval capabilities of GSA algorithm, it is applied to the 3D wind field retrieval of typhoon Nangka data acquired by our research group in Qionghai City, Hainan Province, China, on October 12, 2020.
2. 3D Wind Field Retrieval Algorithm and CDL System
2.1. Wind field retrieval based on the spectrum estimation method
Unlike 3D wind field retrieval methods reliant on radial wind speed, the spectrum estimation method for wind field retrieval can directly extract 3D wind field information from spectral data. It allows comprehensive use of spectrum information even when the correct radial wind speed cannot be retrieved from a single azimuth. Besides, spectrum estimation aggregates signals across various azimuths and averages noise signals, resulting in high retrieval accuracy in low CNR areas.
According to lidar principles[19], the relationship between the Doppler frequency shift and the wind speed vector can be expressed as follows:
Given Eq. (1), the Doppler frequency shift for each azimuth can be calculated through the known 3D wind vector. The spectrum intensity accumulation of different azimuths[20] can be computed as
It is noted that there are three variables,
2.2. Spectrum estimation method based on the GSA algorithm
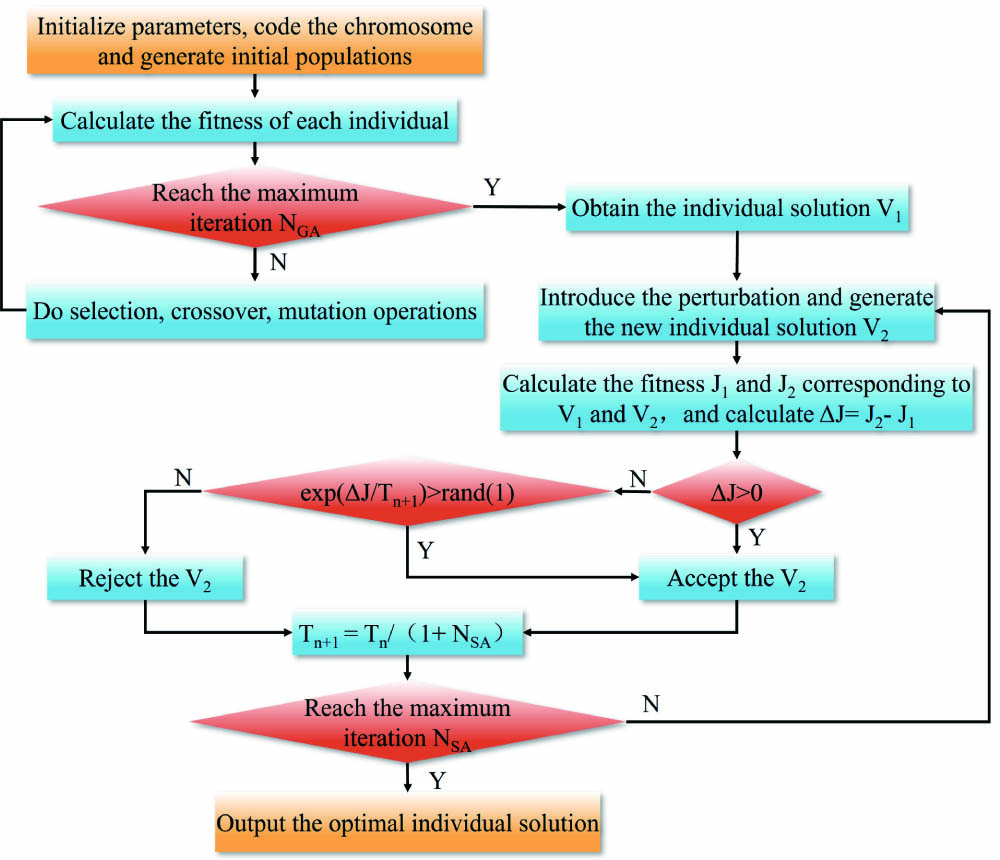
Despite the GA’s ability to search for global optimization without additional information and using probability rules to search, its convergence speed is slow[21,22]. To address this issue, we propose the GSA algorithm to seek optimal solutions. The GSA algorithm not only retains the advantages of GA but also accelerates the convergence speed. Specifically, the GSA algorithm merges the global search ability of GA with the local refinement of simulated annealing (SA), enhancing the efficiency and quality of solutions in complex optimization problems. The detailed procedures of the GSA algorithm are as follows.
The flow chart of the GSA algorithm is shown in Fig. 1.
![]()
Figure 1.Flow chart of the GSA algorithm.
2.3. CDL system
The CDL system is a 1540 nm all-fiber airborne pulsed coherent Doppler lidar developed by our research group in 2016, as depicted in Fig. 2. This system employs an all-fiber single-frequency pulsed laser with a pulse energy of 300 µJ, a pulse width of 400 ns, and a repetition frequency of 10 kHz. The system uses a projection-type scanning mirror for velocity azimuth display (VAD) scanning, with a scanning elevation angle of 20°. Measurements are taken at 8 scanning azimuths with intervals of 45°. The telescope aperture is 100 mm. Additionally, our research group has developed a real-time signal processing board, which acquires wind profiles every 20 seconds, collecting and processing heterodyne frequency signals from the pulse power spectra accumulated at a rate of 10,000 pulses per second. The main parameters of the CDL system are shown in Table 1.
| Parameter | Value | Unit |
|---|---|---|
| Wavelength | 1540 | nm |
| Pulse energy | 300 | µJ |
| Pulse width | 400 | ns |
| Pulse repetition rate | 10 | kHz |
| Power of LO | 0.8 | mW |
| Telescope aperture | 100 | mm |
| Elevation angle | 20 | Degree |
| Intermediate frequency | 160 | MHz |
| Sampling rate of AD converter | 1 | G s-1 |
| Blind distance | 180 | m |
| Range resolution | 60 | m |
Table 1. Main Parameters of the CDL System[23]
![]()
Figure 2.The structure of the CDL system[
3. Results and Analysis of Field Experiment
3.1. Overview of typhoon Nangka
On October 12, 2020, typhoon Nangka was named in the central and eastern regions of the South China Sea. Its wind intensity continuously strengthened as it moved in a northwestern direction. It made landfall along the coast of Qionghai City, Hainan Province, China, at 19:00 on October 13, with a central wind speed of around 25 m/s. After crossing Hainan Island, it continued westward and hit the coast of Thanh Hoa, Vietnam, at 18:00 on October 14. The path of the typhoon is depicted in Fig. 3[24]. Compared to traditional atmospheric wind fields, typhoons are characterized by strong wind speed and rapid change. These characteristics present new challenges for the use of coherent Doppler lidar.
![]()
Figure 3.Moving path of typhoon Nangka.
3.2. Field experiment and algorithm parameter setting
In this experiment, five types of unmanned aerial vehicles (UAVs) were used to observe the typhoon. All these UAVs took off from Qionghai in Hainan, China, situated merely 40 km away from the typhoon, within the hazardous semi-circle of the typhoon’s moving path. On October 12, 2020, our research group used the CDL system, inertial navigation system (INS), and global positioning system (GPS) to observe typhoon wind speed and record the speed and attitude angle (yaw, pitch, and roll) of the UAV. The flight path of the UAV during the experiment is depicted in Fig. 4. As the accuracy and reliability of the CDL system retrieval results have been validated[18], this paper will focus on comparing the retrieval capabilities of different algorithms.
![]()
Figure 4.The flight path of the UAV.
According to Section 2.2, we set the ranges for
3.3. Observation results and discussion
To validate the retrieval capability of the GSA algorithm under low detectability conditions, the 4 sets of the wind profiles retrieved by LSM, GA, and GSA algorithms are compared, as shown in Fig. 5. The results of the three algorithms are essentially consistent in areas above 800 m characterized by high detectability. However, in the lower detectability region below 800 m, the LSM fails to generate retrieval results, but both the GA and GSA algorithm can expand the detection range by approximately 35% more than LSM. This result can be explained as follows: at low CNR regions, the LSM algorithm’s effectiveness is limited due to no useful radial wind data, whereas the GA and GSA algorithm based on spectrum estimation effectively reduce noise interference by accumulating signals from various directions, achieving higher retrieval accuracy even when accurate radial wind speeds cannot be obtained from a single azimuth. This demonstrates the high retrieval ability of both the GA and GSA algorithm.
![]()
Figure 5.Wind profile retrieval results by LSM, GA, and GSA algorithm. (a), (c), (e), (g) Horizontal wind speed. (b), (d), (f), (h) Horizontal wind direction.
To further verify the reliability of the retrieval results by the GSA algorithm, we compared 1080 samples of the horizontal wind speed and direction retrieved by the GSA algorithm with those retrieved by the GA, corresponding to altitudes ranging from 180 m to 2670 m, as shown in Figs. 6(a) and 6(b). The correlation coefficients of the horizontal wind speed and direction between the two algorithms exceed 0.985. The mean bias is 0.24 m/s and 1°, respectively, and the root mean square error (RMSE) is 0.38 m/s and 1.5°, respectively. The data sets show a significant positive correlation, indicating that the GSA algorithm can be effectively applied to 3D wind field retrieval.
![]()
Figure 6.Correlation of retrieval results using GA and GSA algorithm. (a) Horizontal wind speed; (b) horizontal wind direction.
To demonstrate the high computation efficiency of the GSA algorithm, we compared it with the GA by observing the variation of the evaluation function with the iteration times. Figure 7 illustrates that the GA needs 50 iterations to converge, while the GSA algorithm converges in just 14 iterations. Furthermore, the time required for one iteration of the GA and GSA algorithm is 34 ms and 6.87 ms, respectively. Thus, the GSA algorithm and GA reach their convergence limits in 96 ms and 1.7 s, respectively. Therefore, the computational efficiency of the GSA algorithm is 17 times higher than that of GA, which is more beneficial for real-time data processing.
![]()
Figure 7.Variation in the evaluation function with the iteration times by the GA and GSA algorithm.
The 3D wind field of typhoon Nangka, including horizontal wind speed, horizontal wind direction, and vertical wind speed along the flight path of the UAV, is presented in Fig. 8, which is retrieved by spectrum estimation method based on the GSA algorithm. Due to the intermittent UAV operation during the flight, some data are not recorded, resulting in the discontinuity in Fig. 8. The retrieval results indicate that the horizontal wind speed between 1200 m and 1800 m altitude reaching around 20 m/s is notably higher than that in other altitude, corresponding to level 9 wind speed. The wind direction is about 250°. If we set 0° as true north, then clockwise rotation represents southwest wind. The vertical wind speed is relatively low, ranging between
![]()
Figure 8.3D wind field retrieval results of typhoon Nangka along the flight path of the UAV based on GSA algorithm. (a) Horizontal wind speed; (b) horizontal wind direction; (c) vertical wind speed.
4. Conclusion
In summary, we propose a retrieval method of spectrum estimation based on the GSA algorithm. This method is used to retrieve 3D wind field of typhoon Nangka that our research group observed on October 12, 2020, in the central and eastern South China Sea. Compared to the LSM, the GA and GSA algorithm enhance detection distance by approximately 35%. In addition, the retrieval results of the GSA algorithm are highly correlated with those of the GA, with correlation coefficients surpassing 0.985. The mean deviations for horizontal wind speed and direction are 0.24 m/s and 1°, respectively, and the corresponding RMSE values are 0.38 m/s and 1.5°. These results indicate that the GSA algorithm performs well in the retrieval of 3D wind field. Most notably, the computational efficiency of the GSA algorithm is 17 times higher than that of the GA, which is more beneficial for real-time data processing. Overall, the GSA algorithm exhibits excellent performance in both retrieval speed and accuracy.
References
[5] D. Deng, Q. Zhou, L. Ma et al. The wind and wave characteristics during strong typhoon Khanun. Oceanologia et Limnologia Sinica, 54, 1529(2023).
[19] T. Fujii, T. Fukuchi. Laser Remote Sensing(2005).


Set citation alerts for the article
Please enter your email address

© Copyright 2018-2021 | Chinese Laser Press. All Rights Reserved 沪ICP备15018463号-20