• Chinese Optics Letters
  • Vol. 18, Issue 8, 080003 (2020)
Yanchun Shen1, Zhixiong Shen2, Guozhong Zhao1, and Wei Hu2、*
Author Affiliations
  • 1Department of Physics, Capital Normal University, Beijing 100048, China
  • 2Key Laboratory of Intelligent Optical Sensing and Manipulation, College of Engineering and Applied Sciences, Nanjing University, Nanjing 210093, China
  • show less
    DOI: 10.3788/COL202018.080003 Cite this Article Set citation alerts
    Yanchun Shen, Zhixiong Shen, Guozhong Zhao, Wei Hu. Photopatterned liquid crystal mediated terahertz Bessel vortex beam generator [Invited][J]. Chinese Optics Letters, 2020, 18(8): 080003 Copy Citation Text show less
    Normalized phase diagrams of (a) a vortex plate with m=2, (b) a circular grating with Λ=1728 μm, and (c) their integration. (d) Photo of the fabricated LC sample under crossed polarizers (indicated by two orange arrows). Scale bar: 1 mm.
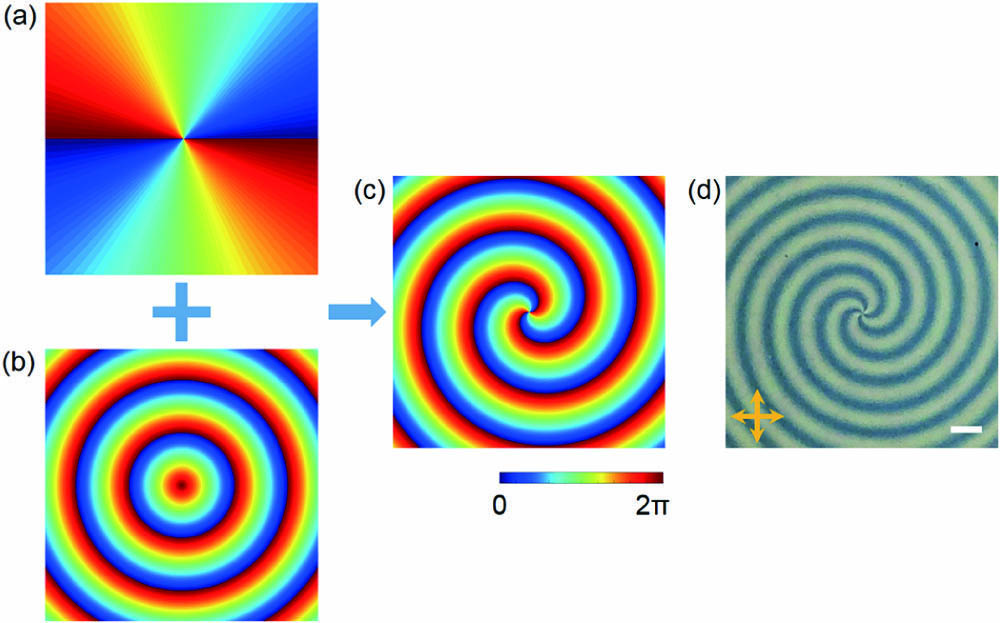
    Fig. 1. Normalized phase diagrams of (a) a vortex plate with m=2, (b) a circular grating with Λ=1728μm, and (c) their integration. (d) Photo of the fabricated LC sample under crossed polarizers (indicated by two orange arrows). Scale bar: 1 mm.
    (a) Simulated normalized THz intensity distribution in the xz plane at 1.2 THz. The white dashed lines indicate z=5 and 20 mm. Simulated THz intensity and phase distributions at 1.2 THz in the xy plane at (b) z=5 mm and (c) z=20 mm, respectively.
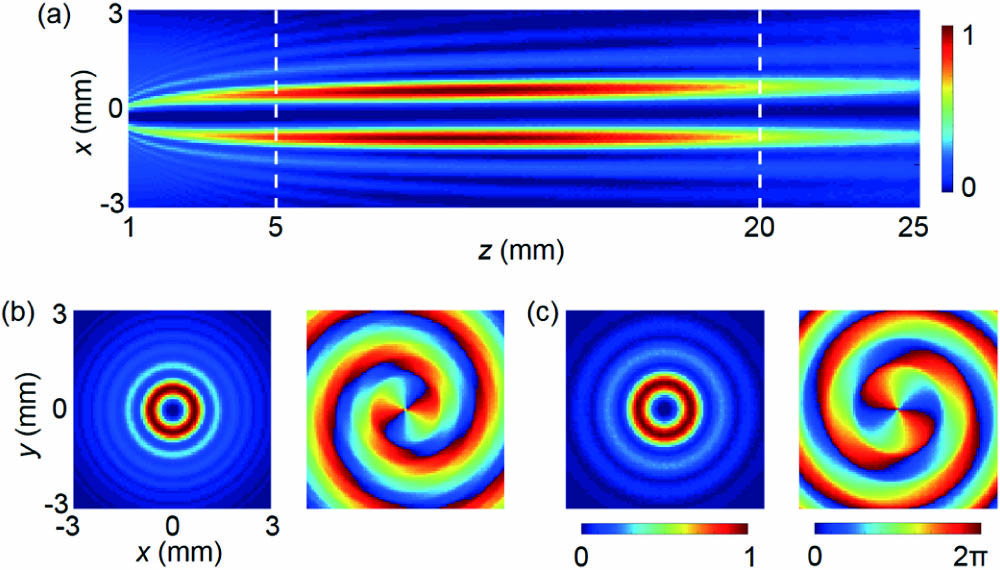
    Fig. 2. (a) Simulated normalized THz intensity distribution in the xz plane at 1.2 THz. The white dashed lines indicate z=5 and 20 mm. Simulated THz intensity and phase distributions at 1.2 THz in the xy plane at (b) z=5mm and (c) z=20mm, respectively.
    (a) Measured THz intensity distributions in the xz plane at 1.2 THz. The white dashed lines indicate z=5, 10, 15, and 20 mm, separately. (b)–(e) Measured THz intensity and phase distributions at 1.2 THz in the xy-plane at (b) z=5 mm, (c) z=10 mm, (d) z=15 mm, and (e) z=20 mm, respectively. (f) Normalized intensity profiles along the x and y axes labeled by the dashed lines in (b). (g) Dependency of PCR on frequency.
    Fig. 3. (a) Measured THz intensity distributions in the xz plane at 1.2 THz. The white dashed lines indicate z=5, 10, 15, and 20 mm, separately. (b)–(e) Measured THz intensity and phase distributions at 1.2 THz in the xy-plane at (b) z=5mm, (c) z=10mm, (d) z=15mm, and (e) z=20mm, respectively. (f) Normalized intensity profiles along the x and y axes labeled by the dashed lines in (b). (g) Dependency of PCR on frequency.
    Measured THz intensity distributions in the xz plane at (a) 1.1 THz and (b) 1.4 THz. The white dashed lines in (a) and (b) indicate z=10 mm. THz intensity and phase distributions in the xy plane at (c) 1.1 THz and (d) 1.4 THz.
    Fig. 4. Measured THz intensity distributions in the xz plane at (a) 1.1 THz and (b) 1.4 THz. The white dashed lines in (a) and (b) indicate z=10mm. THz intensity and phase distributions in the xy plane at (c) 1.1 THz and (d) 1.4 THz.
    Yanchun Shen, Zhixiong Shen, Guozhong Zhao, Wei Hu. Photopatterned liquid crystal mediated terahertz Bessel vortex beam generator [Invited][J]. Chinese Optics Letters, 2020, 18(8): 080003
    Download Citation