
Zibo Zhuang, Yueheng Qiu, Jiaquan Lin, Delong Song. Turbulence warning based on convolutional neural network by lidar[J]. Infrared and Laser Engineering, 2022, 51(4): 20210320
- Infrared and Laser Engineering
- Vol. 51, Issue 4, 20210320 (2022)

Fig. 1. Schematic diagram of Doppler lidar
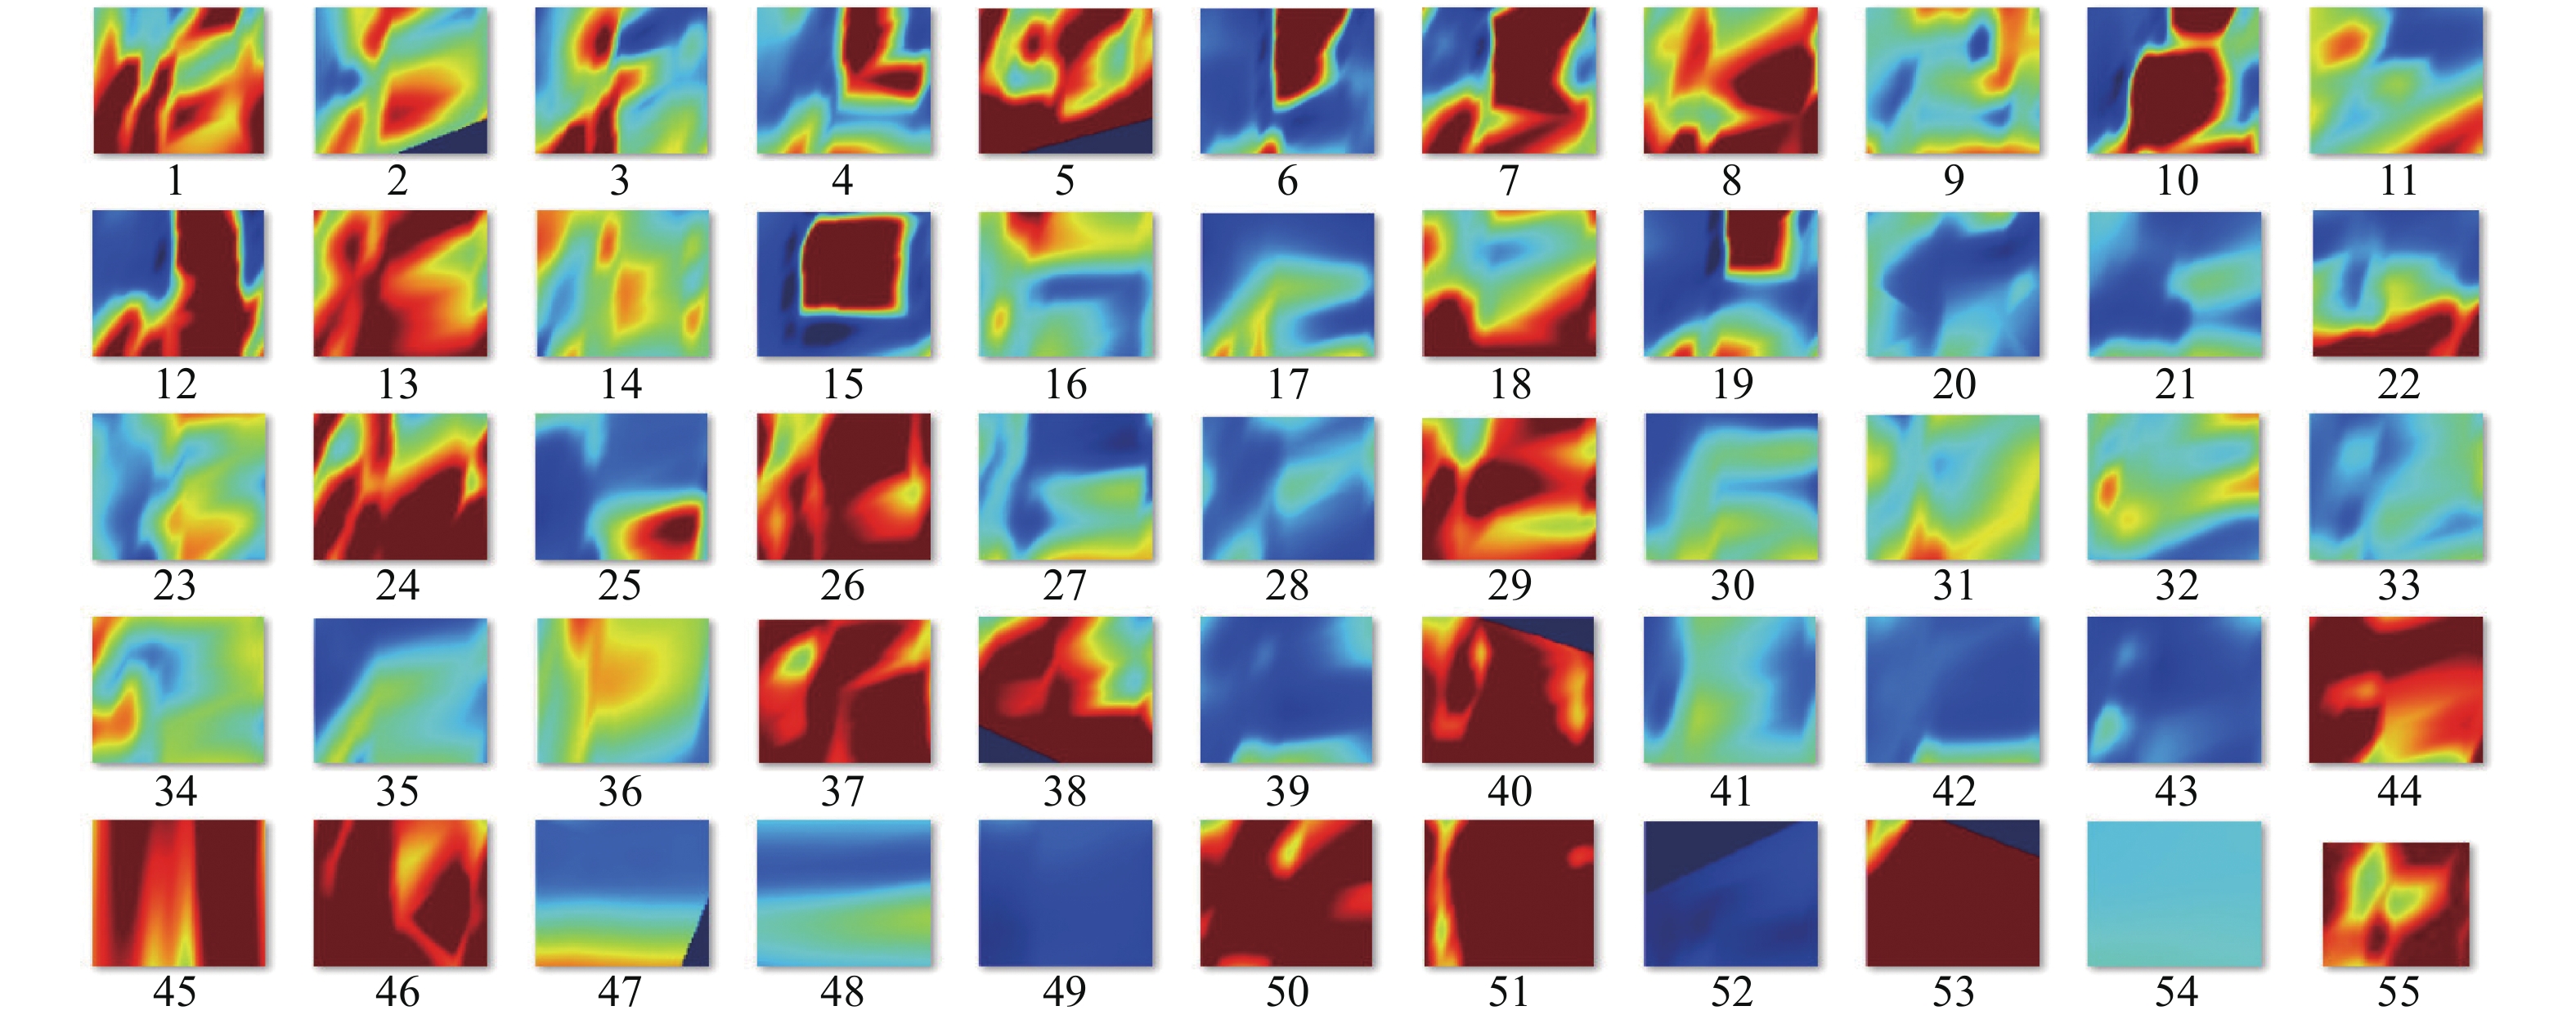
Fig. 2. Schematic diagram of part of the data
Fig. 3. Network input layer eddy current dissipation rate image
Fig. 4. Output result graph of the first convolutional layer
Fig. 5. Output of the second convolutional layer
Fig. 6. Diagram convolutional neural network structuream
Fig. 7. Diagram of CNN training model
Fig. 8. Diagram of convolutional neural network training process
Fig. 9. Schematic diagram of the relationship between decreasing learning rate and network accuracy
Fig. 10. Schematic diagram of loss function during training
Fig. 11. Original data image of two false positives
Fig. 12. Diagram of the judgment of turbulence by two methods
Fig. 13. Schematic diagram of two early warning methods hitting turbulence
|
Table 1. Relevant parameters of lidar
|
Table 2. Turbulence warning statistics of the two methods
|
Table 3. Judgment results made by two methods on 15 sets of unit reports

Set citation alerts for the article
Please enter your email address
© Copyright 2018-2021 | Chinese Laser Press. All Rights Reserved 沪ICP备15018463号-20