
Haoyi Ouyang, Wanjun Chen, Hai Li, Chuping Yang. Single Pixel Detection Theory of Flat Surface Reflectivity Anomaly[J]. Laser & Optoelectronics Progress, 2021, 58(12): 1212003
- Laser & Optoelectronics Progress
- Vol. 58, Issue 12, 1212003 (2021)
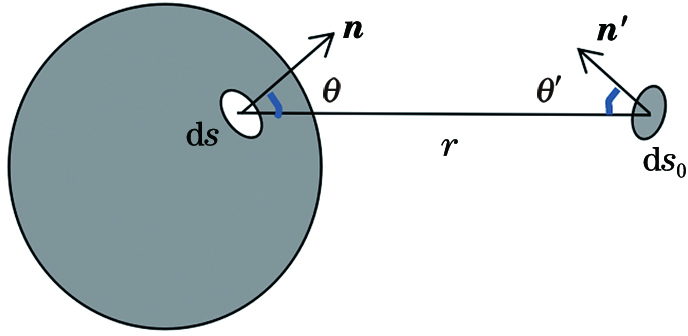
Fig. 1. Direct detection of surface scattering light
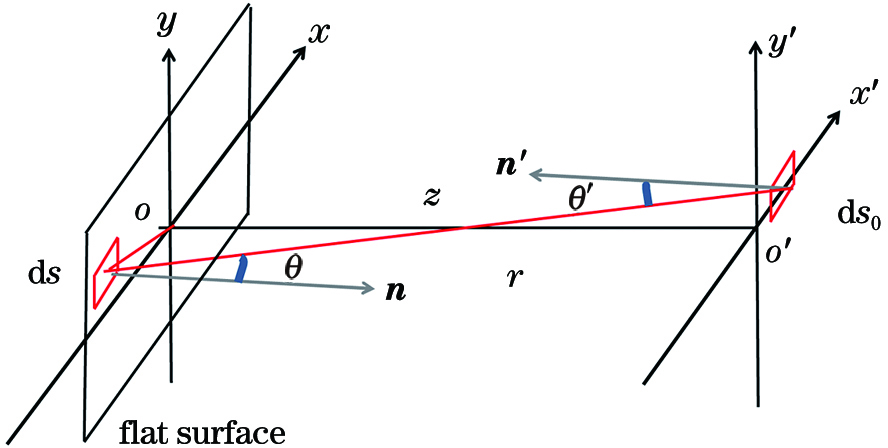
Fig. 2. Measurement coordinate system
Fig. 3. Schematic diagram of system
Fig. 4. Illuminance-signal curve under uniform illumination
Fig. 5. Spatial distribution of radiation flux measured when the measured plane is evenly divided with different spatial resolutions under uniform illumination (left) and its theoretical calculation results (right). (a) 8×8; (b) 16×16; (c) 32×32
Fig. 6. Actual illuminance distribution and theoretical illuminance distribution to achieve uniform radiation flux distribution(resolution: 8×8). (a) Actual illuminance distribution; (b) theoretical illuminance distribution
Fig. 7. Detection of total radiant flux of ceramic tile (illuminance design distribution on sample)
Fig. 8. Seven samples. (a) Sample a; (b) sample b; (c) sample c; (d) sample d; (e) sample e; (f) sample f; (g) sample g
Fig. 9. Two cracked samples. (a) Sample 1; (b) sample 2
Fig. 10. Scratch sample
| ||||||||||||||||||||||||||||||||||||||||||||||||||||||||||||||||||||||||||||||||||||||||
Table 1. Statistics of total radiation fluxes of seven ceramic tile samplesunit: V
| ||||||||||||||||||||||||||||||||||||||||||
Table 2. Total radiation fluxes of uncracked and cracked samples unit: V
| |||||||||||||||||||||||||||||||||||||||||||||||||||||
Table 3. Total radiation fluxes of scratched samples with different depths and unscratched samples unit: V

Set citation alerts for the article
Please enter your email address
© Copyright 2018-2021 | Chinese Laser Press. All Rights Reserved 沪ICP备15018463号-20