Author Affiliations
1Swinburne University of Technology, Centre for Microphotonics, Faculty of Science, Engineering, and Technology, Hawthorn, Australia2National University of Singapore, Department of Electrical and Computer Engineering, Singapore3Rutgers University, Department of Materials Science and Engineering, Piscataway, New Jersey, United States4University of Melbourne, Department of Chemical Engineering, Melbourne, Australia5Monash University, Monash Centre for Atomically Thin Materials, Department of Materials Science and Engineering, Clayton, Australiashow less
Abstract
Microbubbles acting as lenses are interesting for optical and photonic applications such as volumetric displays, optical resonators, integration of photonic components onto chips, high-resolution spectroscopy, lithography, and imaging. However, stable, rationally designed, and uniform microbubbles on substrates such as silicon chips are challenging because of the random nature of microbubble formation. We describe the fabrication of elastic microbubbles with a precise control of volume and curvature based on femtosecond laser irradiated graphene oxide. We demonstrate that the graphene microbubbles possess a near-perfect curvature that allows them to function as reflective microlenses for focusing broadband white light into an ultrahigh aspect ratio diffraction-limited photonic jet without chromatic aberration. Our results provide a pathway for integration of graphene microbubbles as lenses for nanophotonic components for miniaturized lab-on-a-chip devices along with applications in high-resolution spectroscopy and imaging.1 Introduction
Microbubbles are widely applied as actuators in microfluidic devices1 for microfluidic mixing,2 ink-jet printing,3 and logic circuitry.4 More importantly, microbubbles have demonstrated broad applications in therapeutic and medical imaging,5 biomedicine,6 and cell and DNA trapping and manipulation.7 In addition, applications of microbubbles in photonics for lithography8 and optical resonators have recently been demonstrated.9 For applications in imaging, trapping, and photonics, creation of bubbles at accurate positions with a controllable volume, curvature, and stability is essential. However, currently microbubbles can be generated with ultrasonic waves or laser pulses only when substrates are immersed in liquids,10 which are unstable and occur at random locations. For integration into biological or photonic applications, the generation of well controlled and stable microbubbles fabricated using a technique that is compatible with current processing technologies is highly desirable but has not yet been demonstrated. In this paper, we demonstrate the generation of microbubbles on the surface of a solid material using femtosecond laser pulse induced gas generation in a layer of graphene material for the first time. The position, volume, and curvature of the microbubbles are precisely controlled. Such a high-quality bubble can be used for advanced optoelectronic devices with high-precision requirements. As a showcase, near-perfect lenses for focusing broadband white light into an ultrahigh aspect ratio diffraction-limited photonic jet without chromatic aberration are demonstrated in this paper. Our results provide a pathway for integration of graphene microbubbles as dynamic and high-precision nanophotonic components for miniaturized lab-on-a-chip devices, along with applications in high-resolution spectroscopy and medical imaging.
2 Materials and Methods
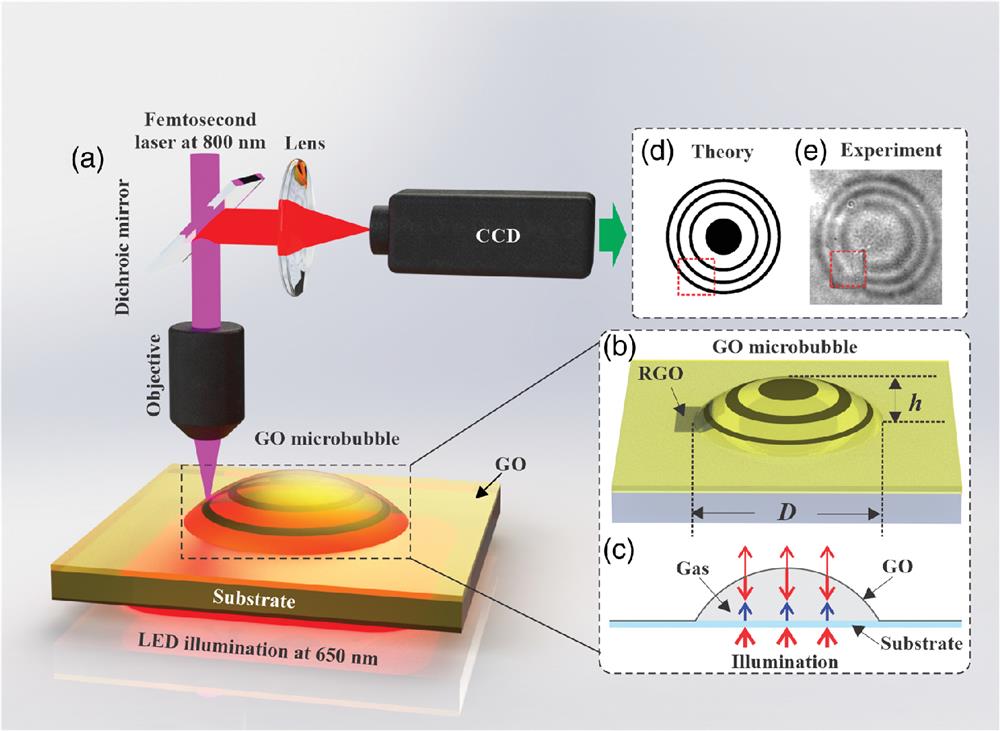
The impermeability of graphene has been used to generate random microbubbles11 and tune their properties by electric fields.12 We irradiate graphene oxide (GO) with a focused laser13–15 in precise locations using a commercial direct laser writing system (Innofocus NanoPrint3D) to create microbubbles in highly localized regions, as shown in Fig. 1(a). In this study, we use the low repetition rate (1 kHz) femtosecond laser writing technique, which is considered to be a “cold” process,16 because the high-instant temperature achieved by a femtosecond laser pulse decreases to room temperature on the timescale of microseconds, before the irradiation of the next femtosecond pulse. Thus the GO film cannot be heated up by the femtosecond laser during the reduction process. The laser irradiation leads to a reduction of GO via evolution of oxygen functional groups.17,18 These evolved gaseous species19,20 are trapped within the reduced GO, forming near-perfect microbubbles at precise locations [see Figs. 1(b)–1(d) and Sec. S1 in the Supplementary Material for more details]. The amount of gas, and therefore the volume, and the size of microbubbles can be finely tuned by varying the laser power and exposure area during the one-step process (see Secs. S2 and S3 in the Supplementary Material).

Figure 1.On-demand generation and in situ characterization of the GO microbubbles. (a) Photoreduction setup with a femtosecond laser beam. The GO microbubbles are generated at the desired positions in an integrated platform. (b) Schematic of a GO microbubble. (c) The interference at the gas–bubble and gas–substrate interfaces. (d) Theoretical schematic of the Newton’s rings that can be observed using a CCD camera. (e) Experimental microscopic image of the observed Newton’s rings.
The microbubbles can be identified by the observation of Newton’s rings that are formed by the interference of light reflected by interfaces between the trapped gas and graphene and between the gas and substrate interface, as indicated in Figs. 1(d) and 1(e). The lateral size of the microbubble is defined by the outermost dark ring that is formed via destructive interference at the edge of the microbubble. The height of the microbubbles can be calculated from the number of rings by a simple equation: , where is the refractive index of the trapped gas (), is the illumination wavelength (650 nm), and is an integer corresponding to the number of rings. The highly symmetric Newton’s rings observed in Fig. 1(e) and their close agreement with the theoretically calculated pattern in Fig. 1(d) suggest that the produced microbubble has a near-perfect spherical curvature, which is attributed to the exceptional mechanical strength of graphene.
Sign up for Advanced Photonics TOC. Get the latest issue of Advanced Photonics delivered right to you!Sign up now
The ability to generate and eliminate microbubbles of various lateral dimensions and heights is demonstrated in Fig. 2. The pristine area before irradiation is shown in Fig. 2(a). As shown in Figs. 2(b)–2(d), the GO film was irradiated in locations indicated by the squares of different sizes. It can be clearly seen that the lateral dimensions and the number of Newton’s rings (height of the microbubble) increase with increasing laser exposure area (see Sec. S4 in the Supplementary Material). This is expected since the laser irradiation of a larger area leads to a greater reduction of GO and the release of more gas. The microbubbles can be eliminated by increasing the laser power to ablate the graphene film to release the gases inside the bubbles [Figs. 2(e)–2(h)]. In Fig. 2(h), the surface of the reduced GO film after the removal of microbubbles is shown. Our analysis reveals that the film is largely flat after release of the gases, due to the high elasticity of graphene. The process for eliminating the bubbles takes about 1.5 s and depends on the volume of enclosed gas and the area of the ablated film. Microbubble generation and gas release can be viewed in Videos S1 and S2.
Figure 2.In situ optical microscopic images showing the process of the microbubble generation and elimination. (a) GO sample before photoreduction and (b)–(d) generated microbubbles corresponding to different reduced areas (Video S1). (e)–(h) Elimination of microbubbles by ablating the reduced area and measured at different times (Video S2). The reduced area is highlighted by the pink color (Video S1, MP4, 1.12 MB [URL: https://doi.org/10.1117/1.AP.2.5.055001.1]; Video S2, MP4, 1.00 MB [URL: https://doi.org/10.1117/1.AP.2.5.055001.2]).
The surface curvature and the volume of microbubbles can be accurately calculated by tracing the position of the rings and reconstructing the surface profile, as shown in Fig. 3. In Fig. 3(a), the area of the microbubble is marked with a white dashed circle and the cross section of the Newton’s rings is marked with a yellow dashed line. The measured radial intensity distributions of the rings in different sized microbubbles shown in Fig. 2 are plotted in Fig. 3(b) and appear as a series of bright and dark fringes. The corresponding reconstructed surface curvatures are shown in Fig. 3(c) and indicate that the height of the microbubbles increases with the size of irradiated area. The three-dimensional (3D) profile of a typical microbubble is shown in Fig. 3(d) and reveals that it exhibits a highly symmetric spherical shape. The uniform thickness of the graphene film, which ensures the isotropic surface tension along all directions, is a key parameter for achieving a highly symmetric spherical surface of the bubble. In order to confirm that the near-perfect spherical surface is achieved, we have fitted the surface curvature with a perfect circle function, which shows a good match (Sec. S6 in the Supplementary Material). This means that the surface profile of the microbubbles is very close to an ideal spherical shape.
Figure 3.Bubble characterization. (a) An in situ optical microscopic image of the Newton’s rings of the microbubble. The overall area of the microbubble is highlighted by the white circle and the direction is marked by the yellow dash line. (b) Intensity profiles of the interference pattern of the microbubbles with different reduced areas. (c) Reconstructed surface profiles of the microbubbles with different reduced areas. A5 to A25 correspond to a photoreduced area of 5 to . (d) Reconstructed 3D profile of the A15 bubble [shown in (a)].
3 Results
The highly uniform surface quality and near-perfect spherical shape of the microbubbles make them ideal reflective microlenses for focusing optical energy. A microscopic imaging system combined with a CCD camera, as shown in Fig. 4(a), was used to measure the intensity distributions in the focal plane of microlenses so that key parameters could be extracted. This was done by placing the graphene microbubble sample on a 1D piezoelectric scanning stage, which scans along the direction of the optical axis ( direction) to record a layer-by-layer series of 2D intensity distributions of the focal spot (the characterization process can be viewed in Videos S3 and S4). To evaluate the focal length of the microbubble, the radius () of the sphere was calculated from the measured radius () and height () of the microbubble, as shown in Fig. 4(b). The focal length of the microbubble can then be obtained from . The numerical aperture (NA) of the microbubble, a parameter that directly determines the resolution of the bubble focus, can be determined using . In addition, the full-width at half-maximum (FWHM) of the focal spot () is , which can be used to characterize the focusing performance of the microlenses. The focal intensity distribution of the microbubble illuminated with a He–Ne laser (633 nm) shows a surprisingly strong 3D focal spot (see Sec. S9 and Fig. S8 in the Supplementary Material), indicating the high quality of the microbubble. Furthermore, from the measured radius and height of the microbubble, NA is estimated to be 0.27, which corresponds to , matching well with the measured FWHM in the direction. This demonstrates that diffraction-limited focusing can be achieved by the graphene microbubble.
Figure 4.Focusing photonic jet with a GO microbubble. (a) Schematic of optical setup for characterizing the GO microbubbles. Left: Experimentally reconstructed 3D image of the characterized GO microbubble. (b) Schematic drawing of the shape of the microbubble as part of a sphere. , height of the bubble; , radius of the bubble; and , radius of the entire sphere. Intensity distribution of the focal spot under white light illumination in the (c) plane and (d) plane (Video S3); the intensity plots along the (e) direction and (f) direction (Videos S3 and S4). (g) The surface plot of the experimentally measured 3D focal spot. The contours from inside correspond to the intensities of 0.8, 0.6, and 0.5 of the normalized peak intensity (Video S3, MP4 1.06 MB [URL: https://doi.org/10.1117/1.AP.2.5.055001.3]; Video S4, MP4, 606 KB [URL: https://doi.org/10.1117/1.AP.2.5.055001.4]).
Compared with diffractive graphene flat lenses,21–24 a key advantage of reflective graphene microlenses is that the reflection occurs at the gas-reduced GO interface and therefore material dispersion does not play a role. This means that graphene microbubble microlenses are able to focus light at different wavelengths without dispersion, similar to the reflection lenses in Fourier transform infrared spectrometers.25 To verify this unique feature experimentally, an ultrabroadband white light source (a halogen lamp) was employed for focusing measurements. The resulting intensity distributions in the plane (focal plane) and the plane are shown in Figs. 4(c) and 4(d), respectively, and can be seen to exhibit photonic jet-like features. The corresponding intensity plots along the direction and direction are shown in Figs. 4(e) and 4(f). Negligible broadening of the FWHM () is observed along the direction despite the incoherence of the light source. In contrast, the FWHM along the direction is significantly reduced to due to the broad spectral distribution of the light source, which increases the resolution. These results demonstrate that a 3D focal spot can be achieved with ultra-broadband white light illumination, as shown in Fig. 4(g). The focal spots of different wavelengths overlap extremely well with each other at all normalized intensity levels (0.8, 0.6, and 0.5), as indicated by different colors [Fig. 4(g)].
4 Discussion
This microbubble photonic jet created by reflective graphene microlenses is technologically significant and has clear advantages over a photonic jet that is generated by transmission through a glass microsphere.26 The reflection mode operation of our microlenses means that they are insensitive to material dispersion27 and therefore can generate diffraction-limited focus for broad wavelengths. Second, the size and radius of the microbubbles are readily tunable in situ, allowing adjustable focusing properties. Therefore, GO microbubbles offer a flexible and in situ tuning mechanism for focal length without degrading the focal resolution of the photonic jet. The large focal length leads to long working distances, which is highly desirable for 3D biological imaging in lab-on-a-chip devices.28 As a result, graphene microbubbles are expected to find broad applications in integrated devices for imaging, spectroscopy, and sensing by generating microlenses at arbitrarily desired positions directly on substrates.
References
[1] R. Dijkink, C.-D. Ohl. Laser-induced cavitation based micropump. Lab Chip, 8, 1676-1681(2008).
[2] P. Garstecki et al. Mixing with bubbles: a practical technology for use with portable microfluidic devices. Lab Chip, 6, 207-212(2006).
[3] M. Lee et al. Stabilization and fabrication of microbubbles: applications for medical purposes and functional materials. Soft Matter, 11, 2067-2079(2015).
[4] M. Prakash, N. Gershenfeld. “Microfluidic bubble logic. Science, 315, 832-835(2007).
[5] P. Prentice et al. Membrane disruption by optically controlled microbubble cavitation. Nat. Phys., 1, 107-110(2005).
[6] S. S. Dastgheyb, K. Modjarrad, S. Ebnesajjad, J. R. Eisenbrey. Microbubble applications in biomedicine. Handbook of Polymer Applications in Medicine and Medical Devices, 253-277(2014).
[7] T. Okamoto, T. Suzuki, N. Yamamoto. Microarray fabrication with covalent attachment of DNA using bubble jet technology. Nat. Biotechnol., 18, 438-441(2000).
[8] L. Lin et al. Bubble-pen lithography. Nano Lett., 16, 701-708(2016).
[9] M. Sumetsky, Y. Dulashko, R. Windeler. Optical microbubble resonator. Opt. Lett., 35, 898-900(2010).
[10] X. Zhang, D. Lohse. Perspectives on surface nanobubbles. Biomicrofluidics, 8, 041301(2014).
[11] J. Zabel et al. Raman spectroscopy of graphene and bilayer under biaxial strain: bubbles and balloons. Nano Lett., 12, 617-621(2012).
[12] T. Georgiou et al. Graphene bubbles with controllable curvature. Appl. Phys. Lett., 99, 093103(2011).
[13] Y. Yang et al. Graphene-based multilayered metamaterials with phototunable architecture for on-chip photonic devices. ACS Photonics, 6, 1033-1040(2019).
[14] H. Lin et al. A 90-nm-thick graphene metamaterial for strong and extremely broadband absorption of unpolarized light. Nat. Photonics, 13, 270-276(2019).
[15] K.-T. Lin et al. Structured graphene metamaterial selective absorbers for high efficiency and omnidirectional solar thermal energy conversion. Nat. Commun., 11, 1389(2020).
[16] S. K. Sundaram, E. Mazur. Inducing and probing non-thermal transitions in semiconductors using femtosecond laser pulses. Nat. Mater., 1, 217-224(2002).
[17] X. Zheng et al. Laser trimming of graphene oxide for functional photonic applications. J. Phys. D Appl. Phys., 50, 074003(2017).
[18] Y. L. Zhang et al. Photoreduction of graphene oxides: methods, properties, and applications. Adv. Opt. Mater., 2, 10-28(2014).
[19] H. Zhang et al. Ultrahigh heating rate induced micro-explosive production of graphene for energy storage. J. Power Sour., 442, 227224(2019).
[20] T. Yang et al. Tailoring pores in graphene-based materials: from generation to applications. J. Mater. Chem. A, 5, 16537-16558(2017).
[21] X. Zheng et al. Highly efficient and ultra-broadband graphene oxide ultrathin lenses with three-dimensional subwavelength focusing. Nat. Commun., 6, 8433(2015).
[22] G. Cao et al. Resilient graphene ultrathin flat lens in aerospace, chemical, and biological harsh environment. ACS Appl. Mater. Interfaces, 11, 20298-20303(2019).
[23] G. Cao et al. An accurate design of graphene oxide ultrathin flat lens based on Rayleigh-Sommerfeld theory. Opto-Electron. Adv., 1, 180012(2018).
[24] X. Li et al. Graphene metalens for particle nanotracking. Photonics Res., 8, 1316-1322(2020).
[25] J. Li, B. Jia, M. Gu. Engineering stop gaps of inorganic-organic polymeric 3D woodpile photonic crystals with post-thermal treatment. Opt. Express, 16, 20073-20080(2008).
[26] A. Heifetz et al. Photonic nanojets. J. Comput. Theor. Nanosci., 6, 1979-1992(2009).
[27] B. Born et al. Integration of photonic nanojets and semiconductor nanoparticles for enhanced all-optical switching. Nat. Commun., 6, 8097(2015).
[28] F. Qin et al. Shaping a subwavelength needle with ultra-long focal length by focusing azimuthally polarized light. Sci. Rep., 5, 9977(2015).