
Mauro Temporal, Benoit Canaud, Warren J. Garbett, Rafael Ramis, and Stefan Weber. Irradiation uniformity at the Laser MegaJoule facility in the context of the shock ignition scheme[J]. High Power Laser Science and Engineering, 2014, 2(2): 020000e8
- High Power Laser Science and Engineering
- Vol. 2, Issue 2, 020000e8 (2014)
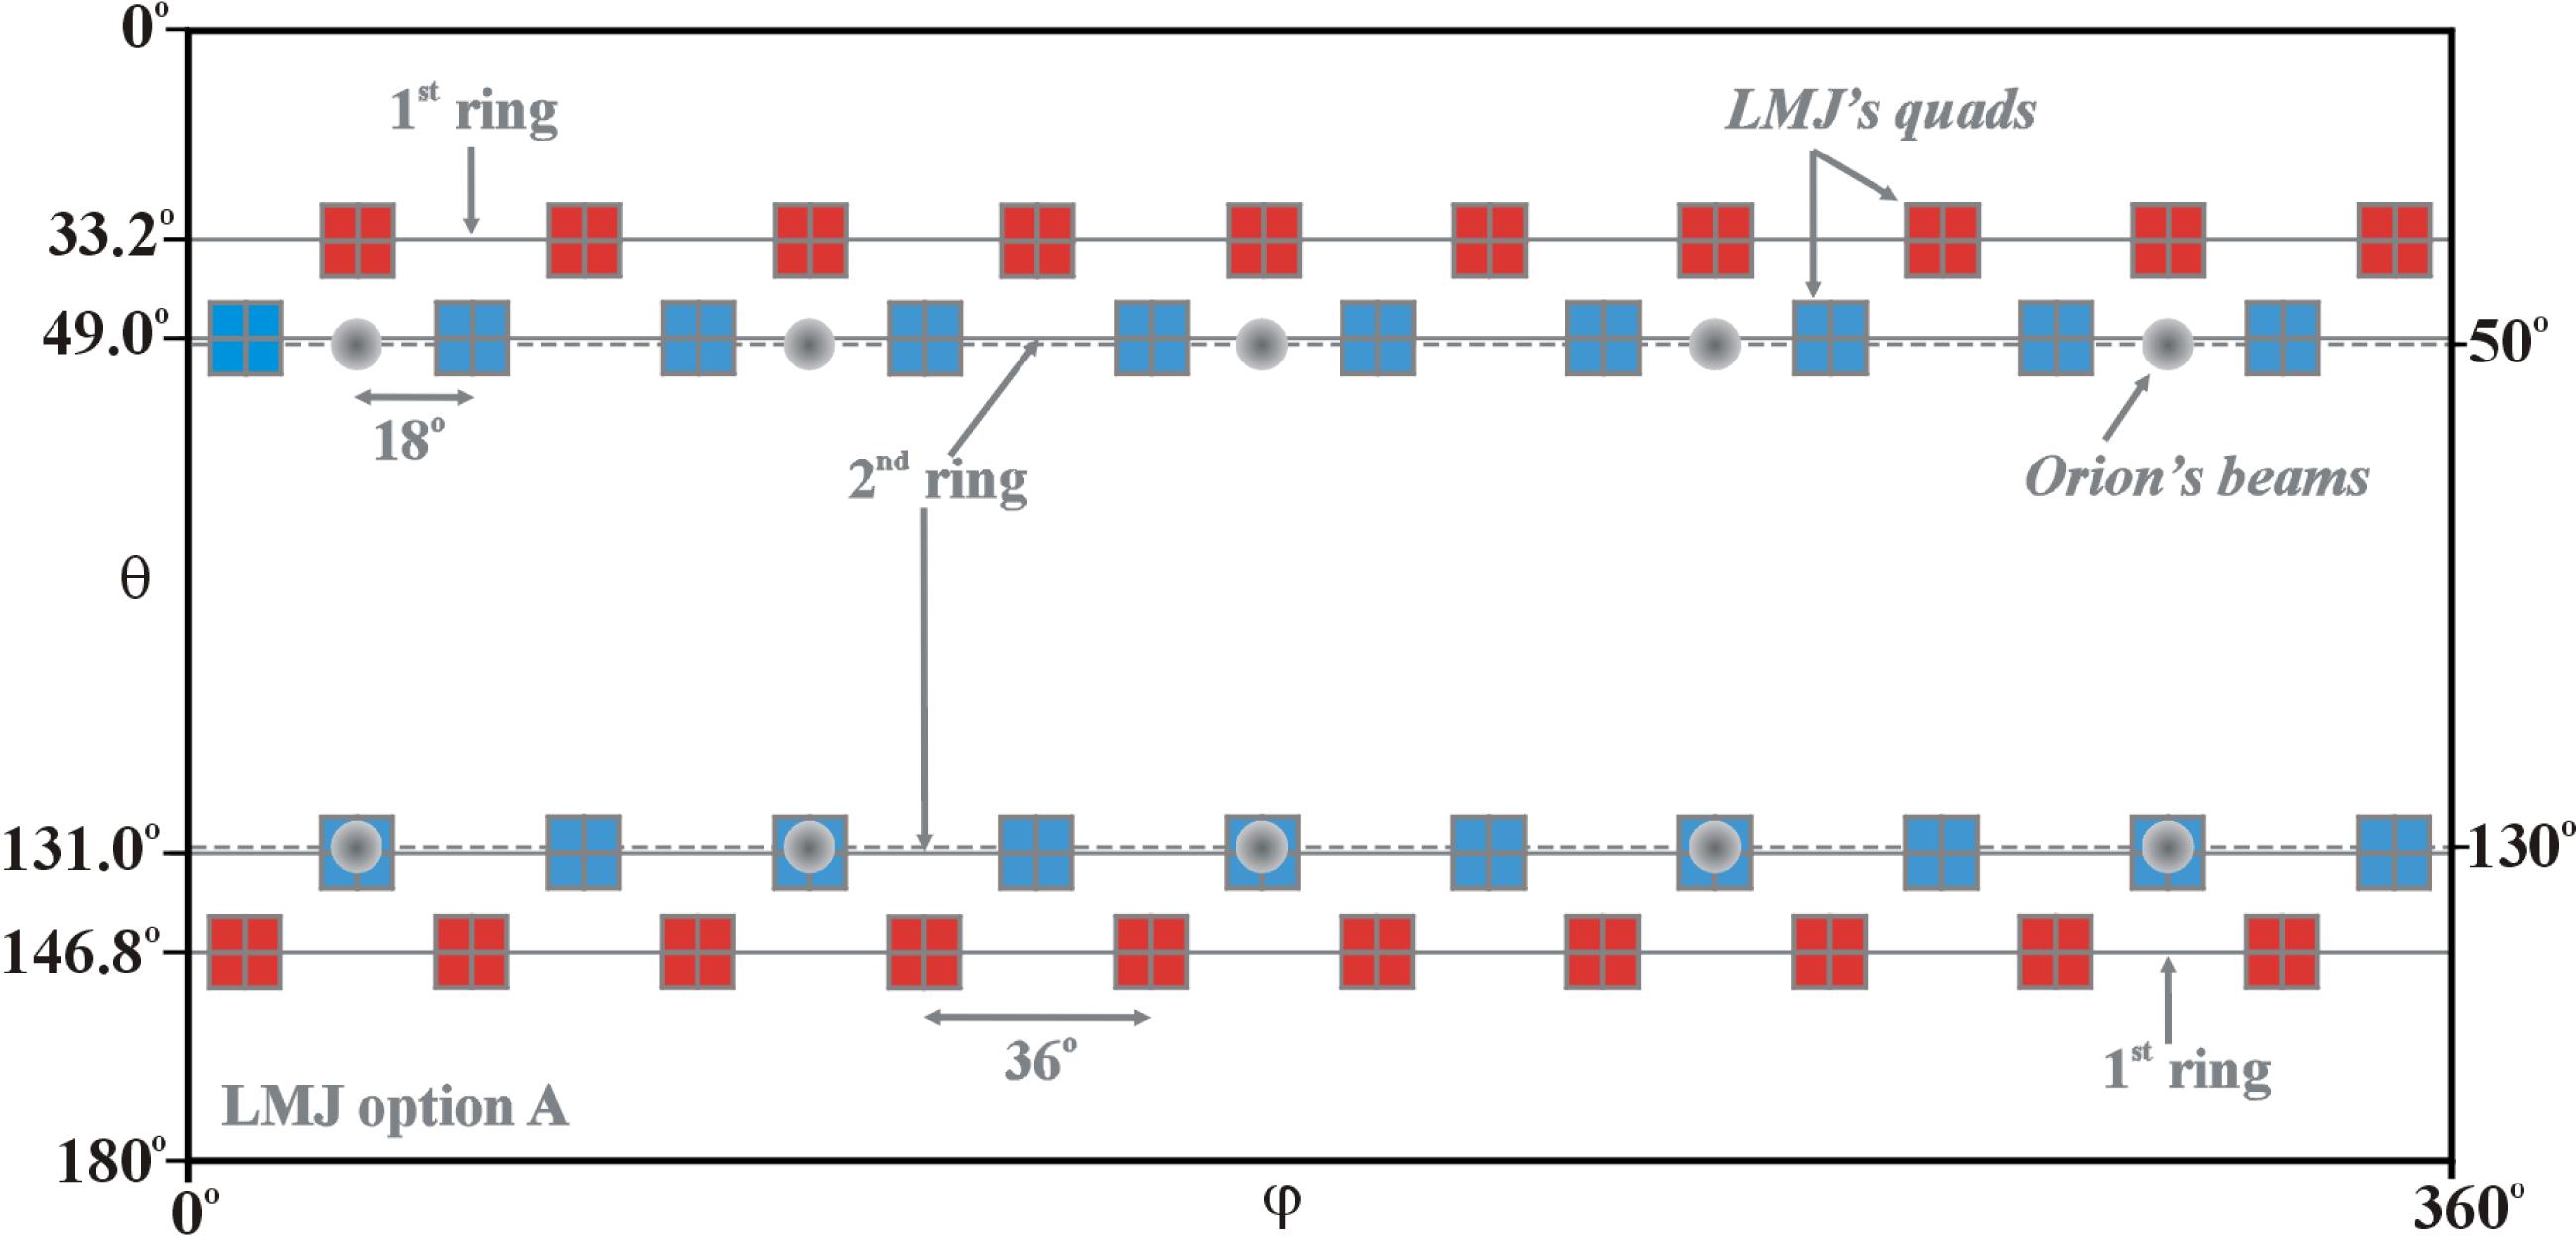
Fig. 1. Angular coordinate of the 40 quads (blue and red boxes) distributed to the first and second ring of the LMJ facility. The gray circles represent the polar coordinates of the 10 long-pulse beams of the Orion facility.
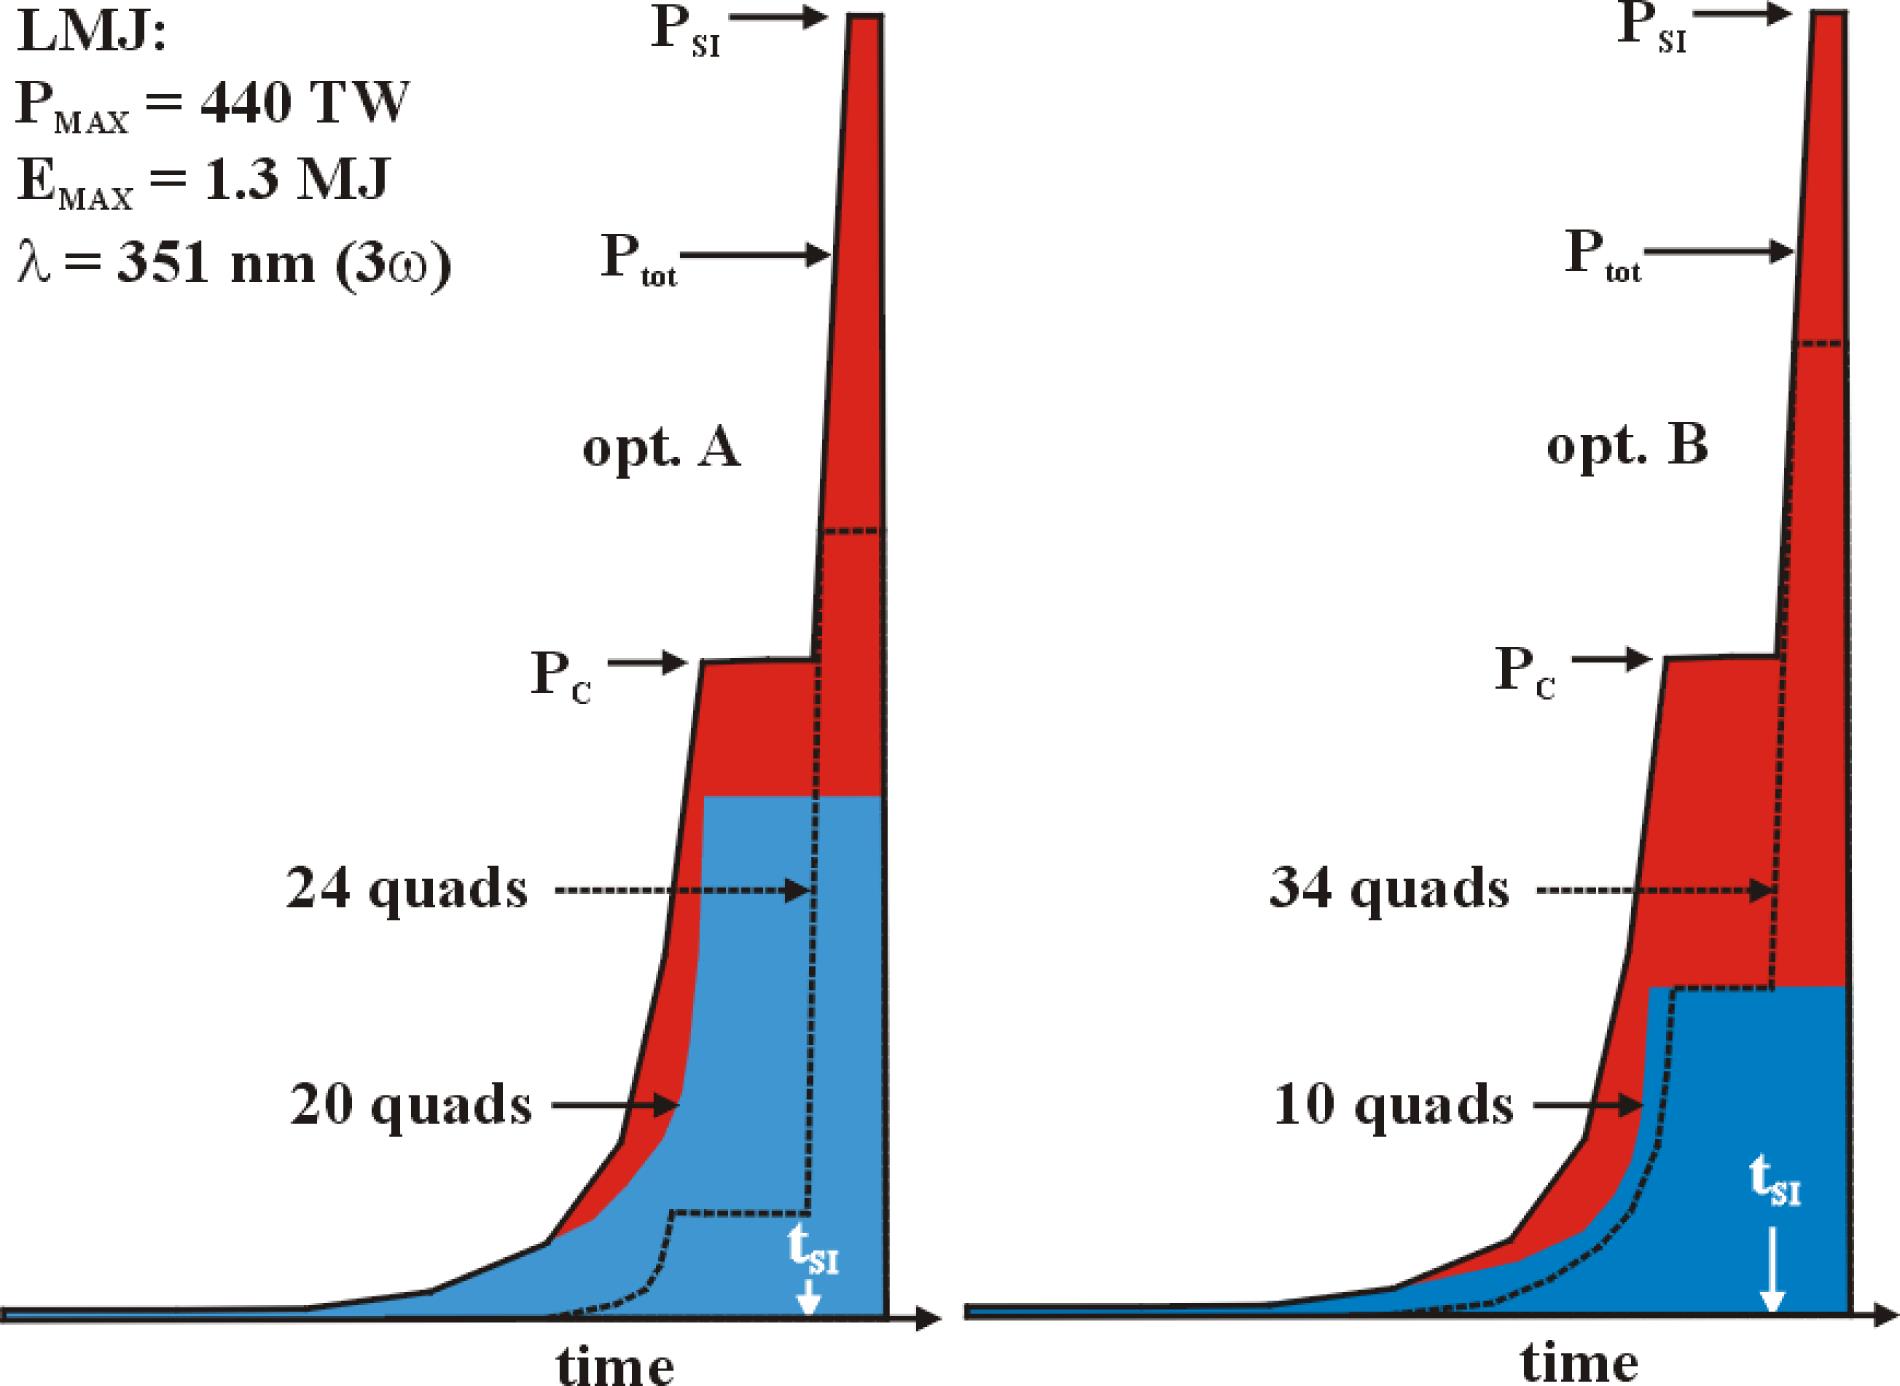
Fig. 2. Sketch of the temporal power profile partition for the two LMJ options, A (left) and B (right), in the shock ignition scheme.
Fig. 3. Capsule dimensions and temporal evolution of the Lagrangean radii. The temporal profile of the incident and absorbed power are shown by the two shadowed areas. The position of the critical density ( ) and evolution of the maximum incident laser intensity (
 ) are also shown as a function of time.
) and evolution of the maximum incident laser intensity () are also shown as a function of time. Fig. 4. Gain as a function of the starting time  and of the maximum power
  of the shock ignition pulse. (
a ) Gain  , calculated with
  ; (
; (b ) Gain  , calculated assuming
  . The white curves represent isovalues of the absorption,
  [%].
[%].
and of the maximum power of the shock ignition pulse. (, calculated with ; (, calculated assuming . The white curves represent isovalues of the absorption, [%]. Fig. 5. Average illumination non-uniformities  (red curves) and intrinsic non-uniformities
  (blue curves) as a function of the capsule radius
  evaluated for the LMJ configuration (option A). Continuous and dashed curves refer to the elliptical and circular laser intensity profile, respectively.
(red curves) and intrinsic non-uniformities (blue curves) as a function of the capsule radius evaluated for the LMJ configuration (option A). Continuous and dashed curves refer to the elliptical and circular laser intensity profile, respectively. Fig. 6. Polar plot of the intensity profile  provided by two axis-symmetric laser beams illuminating a capsule of radius
  . The laser intensity profiles are elliptical (red) and circular (blue), while the dashed circle is the reference of a perfectly uniform irradiation.
provided by two axis-symmetric laser beams illuminating a capsule of radius . The laser intensity profiles are elliptical (red) and circular (blue), while the dashed circle is the reference of a perfectly uniform irradiation. Fig. 7. Average irradiation non-uniformity  as a function of the capsule radius
  for the LMJ options A (blue) and B (red) with (continuous) and without (dashed) applying PDD. In the cases applying PDD, the optimum PDD parameter
  is also shown.
as a function of the capsule radius for the LMJ options A (blue) and B (red) with (continuous) and without (dashed) applying PDD. In the cases applying PDD, the optimum PDD parameter is also shown. Fig. 8. Variation of the average non-uniformity with respect to the laser–capsule uncertainties. Continuous (dashed) curves refer to LMJ option A (B).
Fig. 9. Average non-uniformity as a function of the PDD parameter  and of the super-Gaussian exponent
  of the laser intensity profile.
and of the super-Gaussian exponent of the laser intensity profile. Fig. 10.  (black squares,
  ) and
) and  (white squares,
  ) at
) at  ns, as a function of the number of quads,
  . Rings of opposite hemispheres are rotated against each other by an angle of
  .
.
(black squares, ) and (white squares, ) at ns, as a function of the number of quads, . Rings of opposite hemispheres are rotated against each other by an angle of . Fig. 11.  (
( ) and
) and  (
( ) evaluated at
  ns, as a function of the number of quads,
  . Rings of opposite hemispheres are symmetric with respect to the equatorial plane.
() and () evaluated at ns, as a function of the number of quads, . Rings of opposite hemispheres are symmetric with respect to the equatorial plane. 
Set citation alerts for the article
Please enter your email address
© Copyright 2018-2021 | Chinese Laser Press. All Rights Reserved 沪ICP备15018463号-20