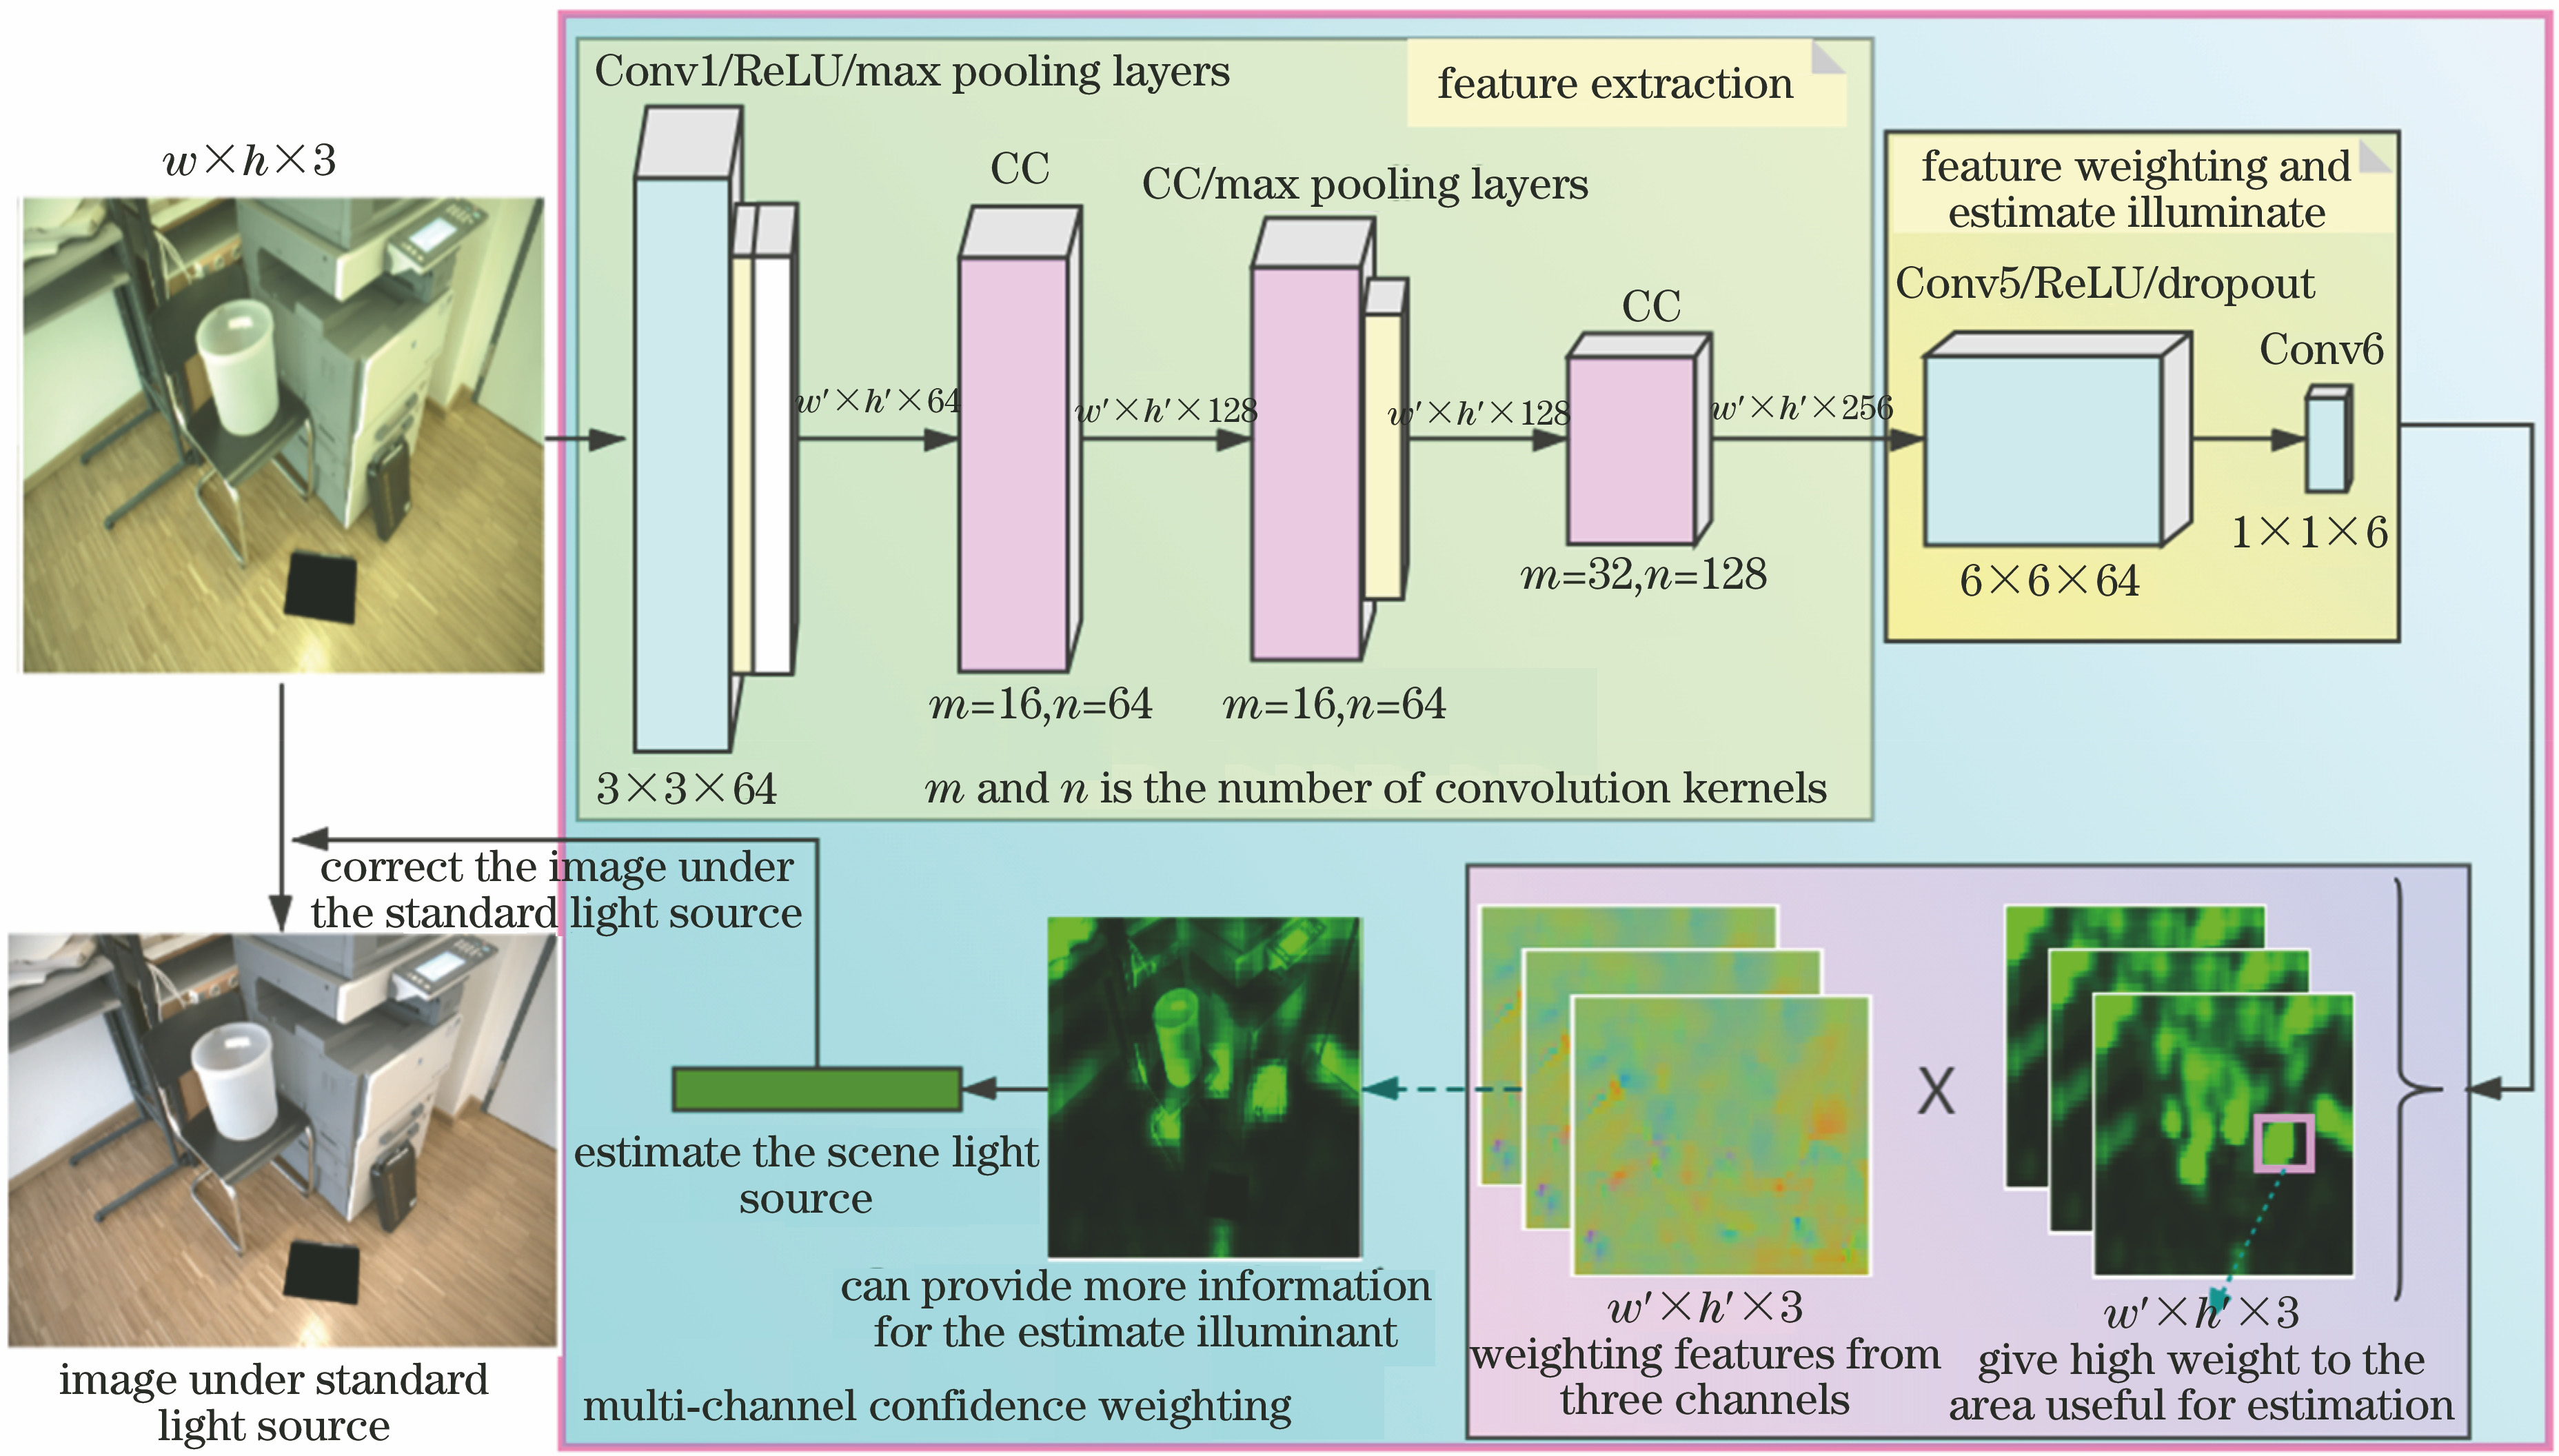
Fig. 1. Network structure
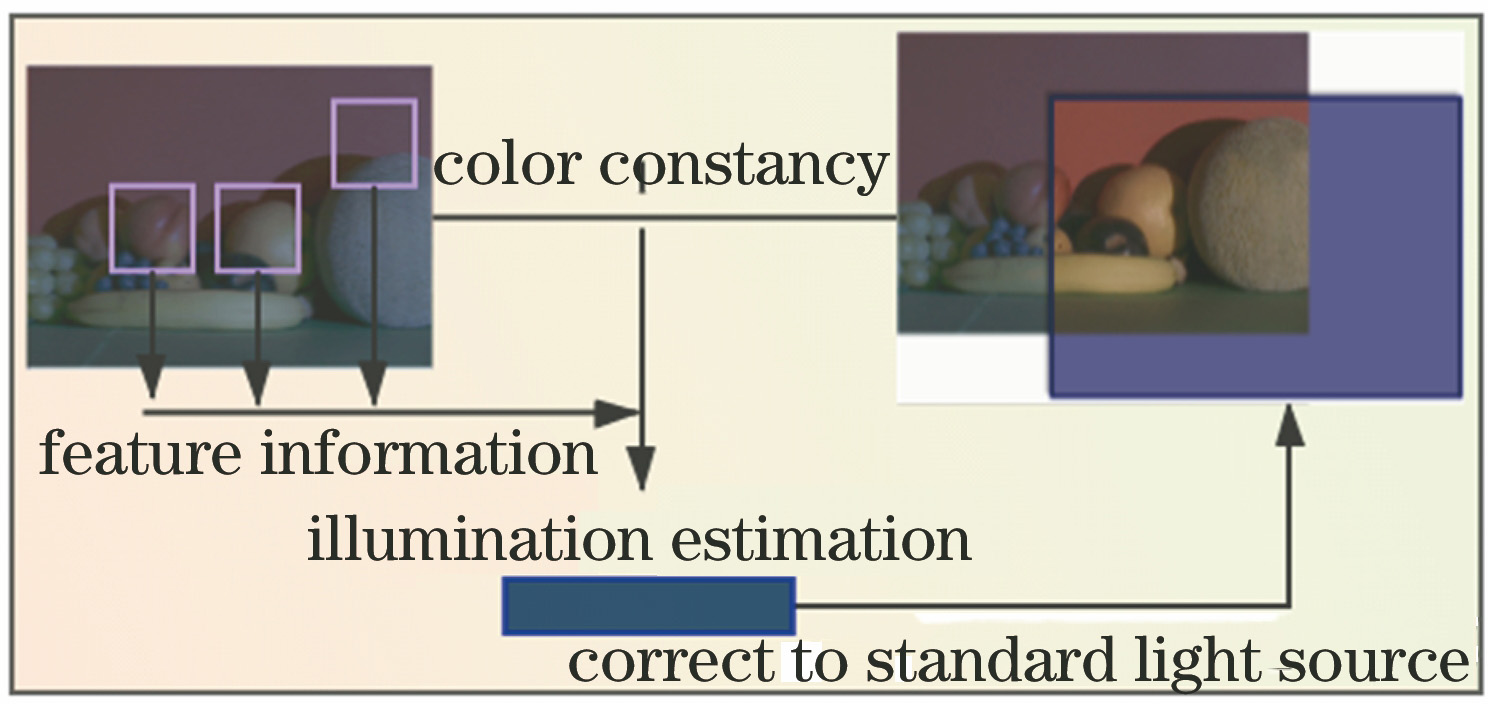
Fig. 2. Flow chart of the color constancy algorithm
Fig. 3. Ambiguous of the light source estimation
Fig. 4. Comparison of the number of confidence-weighted areas of single-channel and three-channel light source
Fig. 5. CC module network structure diagram
Fig. 6. Samples of the dataset
Fig. 7. Diagram of the network training stage
Fig. 8. Graph of the network training loss value
Fig. 9. Visualization of the network output. (a) Input images; (b) using proposed algorithm to estimate images corrected by light source; (c) weight distribution diagrams of proposed algorithm to weight the image multi-channel confidence; (d) standard light source; (e) Grey-world algorithm; (f) White-Patch algorithm; (g) Shades-of-Grey algorithm; (h) Grey-Edge algorithm
| Method | Number of parameters /M |
|---|
| Lou[22] | 56.9 | | CNN[7] | 14.9 | | DS-Net[23] | 4.2 | | FC4(AlexNet)[14] | 2.9 | | FC4(SqueezeNet)[14] | 1.2 | | IEN+PSN[21] | 1.6 | | Proposed method | 0.7 |
|
Table 1. Comparison of the number of network parameters between proposed algorithm and other algorithms
| Method | Mean | Median | Triple mean | Best 25% | Worst 25% |
|---|
| Grey-word[26] | 4.140 | 3.200 | 3.390 | 0.900 | 9.000 | | White-Patch[27] | 10.620 | 10.580 | 10.490 | 1.860 | 19.450 | | Shades-of-Grey[28] | 3.400 | 2.570 | 2.730 | 0.770 | 7.410 | | 1-order Grey Edge[4] | 3.200 | 2.220 | 2.430 | 0.720 | 7.360 | | 2-order Grey Edge[4] | 3.200 | 2.260 | 2.440 | 0.750 | 7.270 | | Pixel-based Gamut[29] | 7.700 | 6.710 | 6.900 | 2.510 | 14.050 | | Edge-based Gamut[29] | 8.430 | 7.050 | 7.370 | 2.410 | 16.080 | | Bayesian[6] | 3.670 | 2.730 | 2.910 | 0.820 | 8.210 | | Using CNNs[7] | 7.600 | 6.900 | 7.400 | 3.000 | 12.400 | | Deep color constancy[22] | 6.200 | 5.000 | 5.400 | 3.900 | 8.600 | | CCC[30] | 2.800 | 1.800 | 1.900 | 0.850 | 6.300 | | CC-GANs(pix-pix)[13] | 3.800 | 3.000 | 3.700 | 1.900 | 8.400 | | FC4-AlexNet[14] | 2.120 | 1.530 | 1.670 | 0.480 | 4.780 | | FC4-SqueezeNet[14]IEN+PSN[21]Multi-Hypothesis[31] | 2.2302.1002.350 | 1.5701.3501.550 | 1.2701.5101.730 | 0.4700.4500.460 | 5.1505.0105.620 | | Proposed method | 1.566 | 1.032 | 1.162 | 0.352 | 3.472 |
|
Table 2. Test error results using NUS-8 camera data set
| Method | Mean | Median | Triple mean | Best 25% | Worst 25% | 95th |
|---|
| Grey-world[26] | 10.700 | 10.600 | 10.700 | 3.450 | 12.300 | 17.400 | | White-Patch[27] | 9.800 | 8.000 | 8.900 | 3.800 | 13.600 | 22.300 | | Shades-of-Grey[28] | 8.300 | 7.500 | 7.800 | 2.900 | 11.800 | 17.000 | | 1-order Grey Edge[4] | 5.000 | 3.700 | 4.100 | 3.900 | 10.100 | 13.300 | | 2-order Grey Edge[4] | 5.400 | 4.500 | 4.800 | 2.600 | 9.800 | 12.800 | | Pixel-based Gamut[29] | 6.900 | 5.200 | 5.700 | 1.800 | 11.700 | 18.200 | | Edge-based Gamut[29] | 6.900 | 4.600 | 5.200 | 2.100 | 14.600 | 20.600 | | Bayesian[6]General Grey-World[32] | 6.6007.600 | 4.6006.700 | 5.2007.000 | 3.2003.800 | 10.90012.100 | 18.40016.500 | | Using CNNs[7] | 8.200 | 6.300 | 6.800 | 2.600 | 11.300 | 20.400 | | Deep color constancy[22]Exemplar-Based[33] | 5.7002.890 | 4.7002.270 | 5.0002.420 | 3.2000.820 | 8.4005.970 | 12.4006.950 | | CCC(dist+ext)[30] | 2.000 | 1.220 | 1.400 | 0.350 | 4.760 | 5.850 | | CC-GANs(Pix2Pix)[13] | 3.600 | 2.800 | 3.100 | 1.200 | 7.200 | 9.400 | | FC4-AlexNet[14] | 1.770 | 1.110 | 1.290 | 0.340 | 4.290 | 5.440 | | FC4-SqueezeNet[14]IEN+PSN[21]Multi-Hypothesis[31] | 1.6502.2502.100 | 1.1801.5901.320 | 1.2701.7301.530 | 0.3800.5900.360 | 3.7805.0305.100 | 4.7306.080— | | Proposed method | 1.574 | 1.030 | 1.119 | 0.300 | 3.475 | 4.039 |
|
Table 3. Test error results using the reprocessed ColorChecker data set