• Advanced Photonics
  • Vol. 6, Issue 2, 026006 (2024)
Xiaomin Liu, Yihao Zhang, Yuli Chen, Yichen Liu, Meng Cai, Qizhi Qiu, Mengfan Fu, Lilin Yi, Weisheng Hu, and Qunbi Zhuge*
Author Affiliations
  • Shanghai Jiao Tong University, State Key Laboratory of Advanced Optical Communication Systems and Networks, Department of Electronic Engineering, Shanghai, China
  • show less
    DOI: 10.1117/1.AP.6.2.026006 Cite this Article Set citation alerts
    Xiaomin Liu, Yihao Zhang, Yuli Chen, Yichen Liu, Meng Cai, Qizhi Qiu, Mengfan Fu, Lilin Yi, Weisheng Hu, Qunbi Zhuge. Digital twin modeling and controlling of optical power evolution enabling autonomous-driving optical networks: a Bayesian approach[J]. Advanced Photonics, 2024, 6(2): 026006 Copy Citation Text show less
    The architecture of the proposed BIF for modeling and controlling OAs. (a) The general workflow of the BIF. (b) The employed data collecting method in real systems and simulations. (c) The input and output of the surrogate GPR model. (d) The exploration-preferred acquisition workflow of the OA modeling. (e) The exploitation-preferred acquisition workflow of the OA controlling.
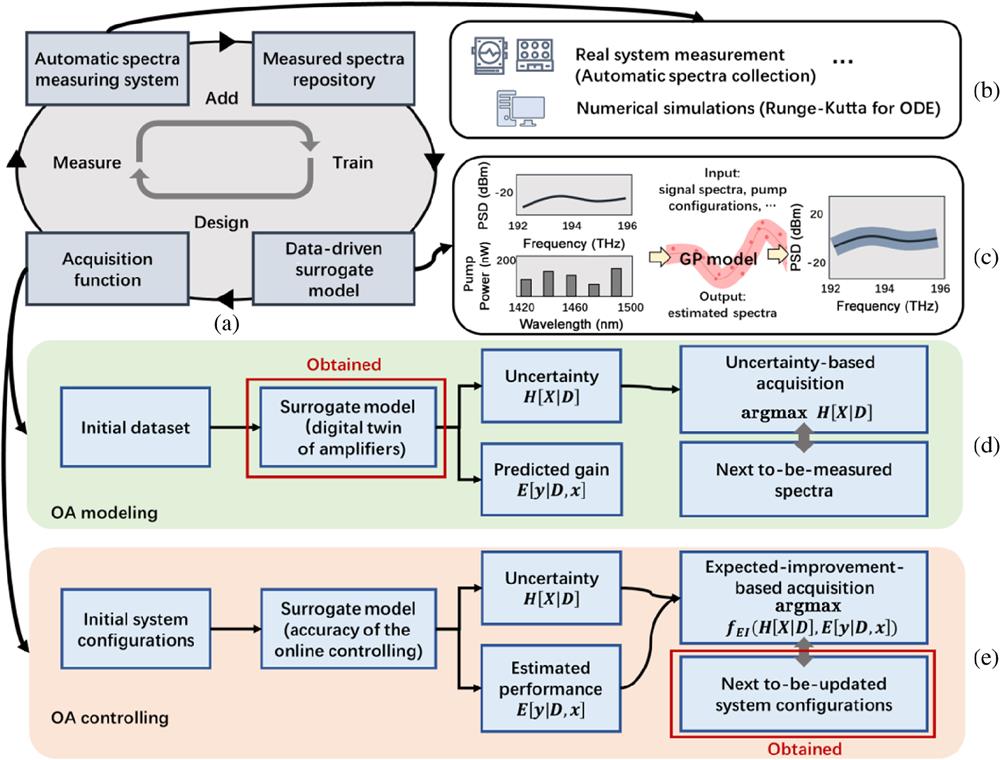
    Fig. 1. The architecture of the proposed BIF for modeling and controlling OAs. (a) The general workflow of the BIF. (b) The employed data collecting method in real systems and simulations. (c) The input and output of the surrogate GPR model. (d) The exploration-preferred acquisition workflow of the OA modeling. (e) The exploitation-preferred acquisition workflow of the OA controlling.
    The diagram of collecting training data for OA modeling. (a) The experimental system for measuring EDFA spectra. (b) The simulation workflow for calculating the GSNR of an RA system.
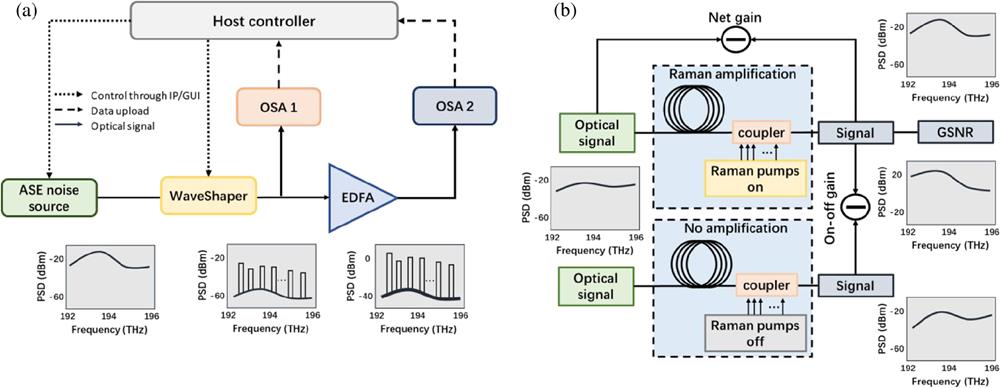
    Fig. 2. The diagram of collecting training data for OA modeling. (a) The experimental system for measuring EDFA spectra. (b) The simulation workflow for calculating the GSNR of an RA system.
    The modeling performance of the proposed BIF for EDFA and RA. (a) and (c) The RMSEs of the models under different data sizes for EDFA modeling and RA modeling, respectively. (b) and (d) The violin plots of the modeling errors under different data sizes for EDFA modeling and RA modeling, respectively. The maximum and minimum errors are plotted. (e) The error histograms of the EDFA gain models trained with 70 data with or without BIF-based modeling design and data selection.
    Fig. 3. The modeling performance of the proposed BIF for EDFA and RA. (a) and (c) The RMSEs of the models under different data sizes for EDFA modeling and RA modeling, respectively. (b) and (d) The violin plots of the modeling errors under different data sizes for EDFA modeling and RA modeling, respectively. The maximum and minimum errors are plotted. (e) The error histograms of the EDFA gain models trained with 70 data with or without BIF-based modeling design and data selection.
    The experimental setup for online controlling in an EDFA system. (a) The controlling workflow of the automatic EDFA measuring system. (b) The signal power of each channel after amplification with different controlling targets. The solid lines are the results obtained by BIF and the dashed lines are the target signal spectra. Figures in the first line show the measured spectra when only adjusting the mean power and the tilt of the transmitted signal spectra. The second line shows the measured spectra when utilizing BIF. (c) The RMSEs’ comparison between the traditional adjustment and BIF-based online controlling. (d) The changes of RMSEs between the measured spectra and the target spectra during BIF-based online controlling when the target gain is flat and set each channel as −2 dBm.
    Fig. 4. The experimental setup for online controlling in an EDFA system. (a) The controlling workflow of the automatic EDFA measuring system. (b) The signal power of each channel after amplification with different controlling targets. The solid lines are the results obtained by BIF and the dashed lines are the target signal spectra. Figures in the first line show the measured spectra when only adjusting the mean power and the tilt of the transmitted signal spectra. The second line shows the measured spectra when utilizing BIF. (c) The RMSEs’ comparison between the traditional adjustment and BIF-based online controlling. (d) The changes of RMSEs between the measured spectra and the target spectra during BIF-based online controlling when the target gain is flat and set each channel as 2  dBm.
    The experimental setup for controlling the gain spectrum of an RA. (a) The controlling workflow of the automatic RA controlling and gain measurement system. (b) The obtained flat gain spectra of the RA based on proposed BIF. (c) The obtained tilted gain spectra of the RA based on proposed BIF. (d) The randomly generated gain spectra of the RA under various combinations of pump powers. (e) The RMSEs for each iteration during the online controlling. (f) The measured gain spectra after each iteration during the online controlling. The gray lines are the precollected gain spectra, and the solid lines are the collected gain spectra during the online controlling. Different colors denote different iterations. The dashed black line is the target gain spectrum. Some obtained gain spectra during the online controlling, i.e., the red points in panel (e) are plotted in (g), (h), (i), and (j), respectively. The pump DAC values of each iteration are plotted in the second line accordingly.
    Fig. 5. The experimental setup for controlling the gain spectrum of an RA. (a) The controlling workflow of the automatic RA controlling and gain measurement system. (b) The obtained flat gain spectra of the RA based on proposed BIF. (c) The obtained tilted gain spectra of the RA based on proposed BIF. (d) The randomly generated gain spectra of the RA under various combinations of pump powers. (e) The RMSEs for each iteration during the online controlling. (f) The measured gain spectra after each iteration during the online controlling. The gray lines are the precollected gain spectra, and the solid lines are the collected gain spectra during the online controlling. Different colors denote different iterations. The dashed black line is the target gain spectrum. Some obtained gain spectra during the online controlling, i.e., the red points in panel (e) are plotted in (g), (h), (i), and (j), respectively. The pump DAC values of each iteration are plotted in the second line accordingly.
    The simulation performance of the BIF for online controlling with different on–off gain spectra. (a)–(c) The performance of the BIF with flat target gain. The simulated RAs have four, five, and six pumps, respectively. The solid lines are the experimental results and the dashed lines are the target spectra. (d)–(f) The performance of the BIF with tilt target gain. The simulated RAs have four, five, and six pumps, respectively. The solid lines are the results obtained by BIF, and the dashed lines are the target gain spectra.
    Fig. 6. The simulation performance of the BIF for online controlling with different on–off gain spectra. (a)–(c) The performance of the BIF with flat target gain. The simulated RAs have four, five, and six pumps, respectively. The solid lines are the experimental results and the dashed lines are the target spectra. (d)–(f) The performance of the BIF with tilt target gain. The simulated RAs have four, five, and six pumps, respectively. The solid lines are the results obtained by BIF, and the dashed lines are the target gain spectra.
    Xiaomin Liu, Yihao Zhang, Yuli Chen, Yichen Liu, Meng Cai, Qizhi Qiu, Mengfan Fu, Lilin Yi, Weisheng Hu, Qunbi Zhuge. Digital twin modeling and controlling of optical power evolution enabling autonomous-driving optical networks: a Bayesian approach[J]. Advanced Photonics, 2024, 6(2): 026006
    Download Citation