• Laser & Optoelectronics Progress
  • Vol. 58, Issue 16, 1612002 (2021)
Le Wang1、2, Qian Zhou1, Yue Fang1, Shengchun Wang1、*, Guoqing Li1, Hao Wang1, Shengwei Ren1, Peng Dai1, and Fan Wang1
Author Affiliations
  • 1Infrastructure Inspection Research Institute, China Academy of Railway Sciences Corporation Limited, Beijing 100081, China
  • 2Graduate Department, China Academy of Railway Sciences, Beijing 100081, China
  • show less
    DOI: 10.3788/LOP202158.1612002 Cite this Article Set citation alerts
    Le Wang, Qian Zhou, Yue Fang, Shengchun Wang, Guoqing Li, Hao Wang, Shengwei Ren, Peng Dai, Fan Wang. Detection Method of Rail Fastener Fastening State Based on Line Structured Light[J]. Laser & Optoelectronics Progress, 2021, 58(16): 1612002 Copy Citation Text show less
    Principle diagram of 3D measurement based on line structured light
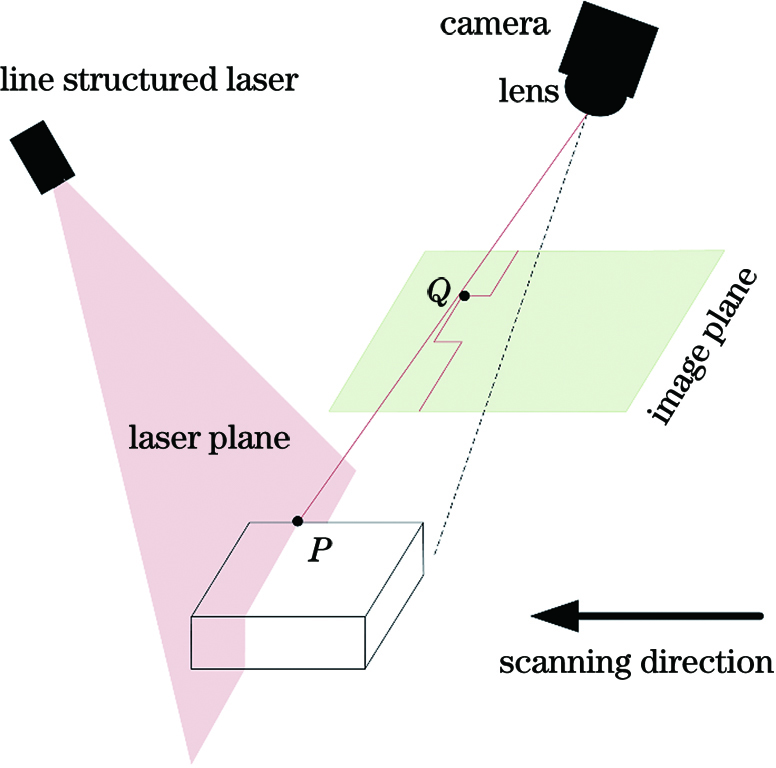
    Fig. 1. Principle diagram of 3D measurement based on line structured light
    3D measurement system
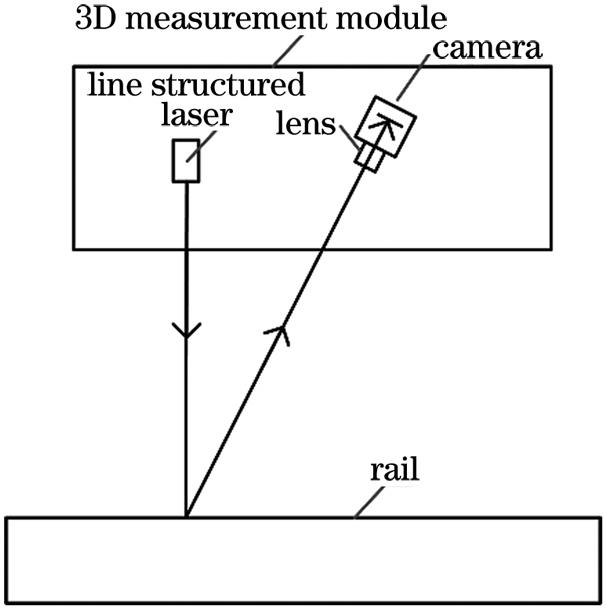
    Fig. 2. 3D measurement system
    3D point cloud data acquisition system
    Fig. 3. 3D point cloud data acquisition system
    Principle diagram of track 3D point cloud data acquisition
    Fig. 4. Principle diagram of track 3D point cloud data acquisition
    Flow chart of fastener fastening state detection
    Fig. 5. Flow chart of fastener fastening state detection
    Height distribution of i-th contour
    Fig. 6. Height distribution of i-th contour
    Cumulative height function G(k,i) of profile i
    Fig. 7. Cumulative height function G(k,i) of profile i
    Segmentation results of rail and fastener area (sampling interval of left rail is 1 mm)
    Fig. 8. Segmentation results of rail and fastener area (sampling interval of left rail is 1 mm)
    Wheel rail contact diagram
    Fig. 9. Wheel rail contact diagram
    Schematic of non-wear rectangular area outside rail head (sampling interval of left rail profile is 1 mm)
    Fig. 10. Schematic of non-wear rectangular area outside rail head (sampling interval of left rail profile is 1 mm)
    Flow chart of online updating threshold database
    Fig. 11. Flow chart of online updating threshold database
    Static accuracy verification at laboratory. (a) Measuring device; (b) two standard blocks; (c) standard block laser section image; (d) measured profile of standard block
    Fig. 12. Static accuracy verification at laboratory. (a) Measuring device; (b) two standard blocks; (c) standard block laser section image; (d) measured profile of standard block
    Dynamic test from scene. (a) 3D measurement module; (b) field installation; (c) 3D reconstruction of rail; (d) measured profile of rail
    Fig. 13. Dynamic test from scene. (a) 3D measurement module; (b) field installation; (c) 3D reconstruction of rail; (d) measured profile of rail
    Wear measurement error perpendicular to rail from scene
    Fig. 14. Wear measurement error perpendicular to rail from scene
    Bolt heights on both sides of rail. (a) Bolt height distributions on both sides; (b) height difference of bolts on both sides
    Fig. 15. Bolt heights on both sides of rail. (a) Bolt height distributions on both sides; (b) height difference of bolts on both sides
    Block positionMeasured valueMeasurement error
    Starting position8.980.02
    Midpoint position8.940.06
    Terminal position8.910.09
    Table 1. Static precision at laboratory unit: mm
    ConditionNTPNFPP /%
    Tl=6, nmax=101262086.3
    Tt=8, nmax=10451081.8
    Table 2. Judgment results of fastener fastening state
    Le Wang, Qian Zhou, Yue Fang, Shengchun Wang, Guoqing Li, Hao Wang, Shengwei Ren, Peng Dai, Fan Wang. Detection Method of Rail Fastener Fastening State Based on Line Structured Light[J]. Laser & Optoelectronics Progress, 2021, 58(16): 1612002
    Download Citation