
Deming Kong, Yumeng Li, Yaoyao Cui, Chunxiang Zhang, Shutao Wang, Xijun Wu. Application in Identification of Adulterated Sesame Oil for Three-Dimensional Fluorescence Spectroscopy Combined with Wavelet Compression and APTLD[J]. Acta Optica Sinica, 2019, 39(3): 0330004
- Acta Optica Sinica
- Vol. 39, Issue 3, 0330004 (2019)
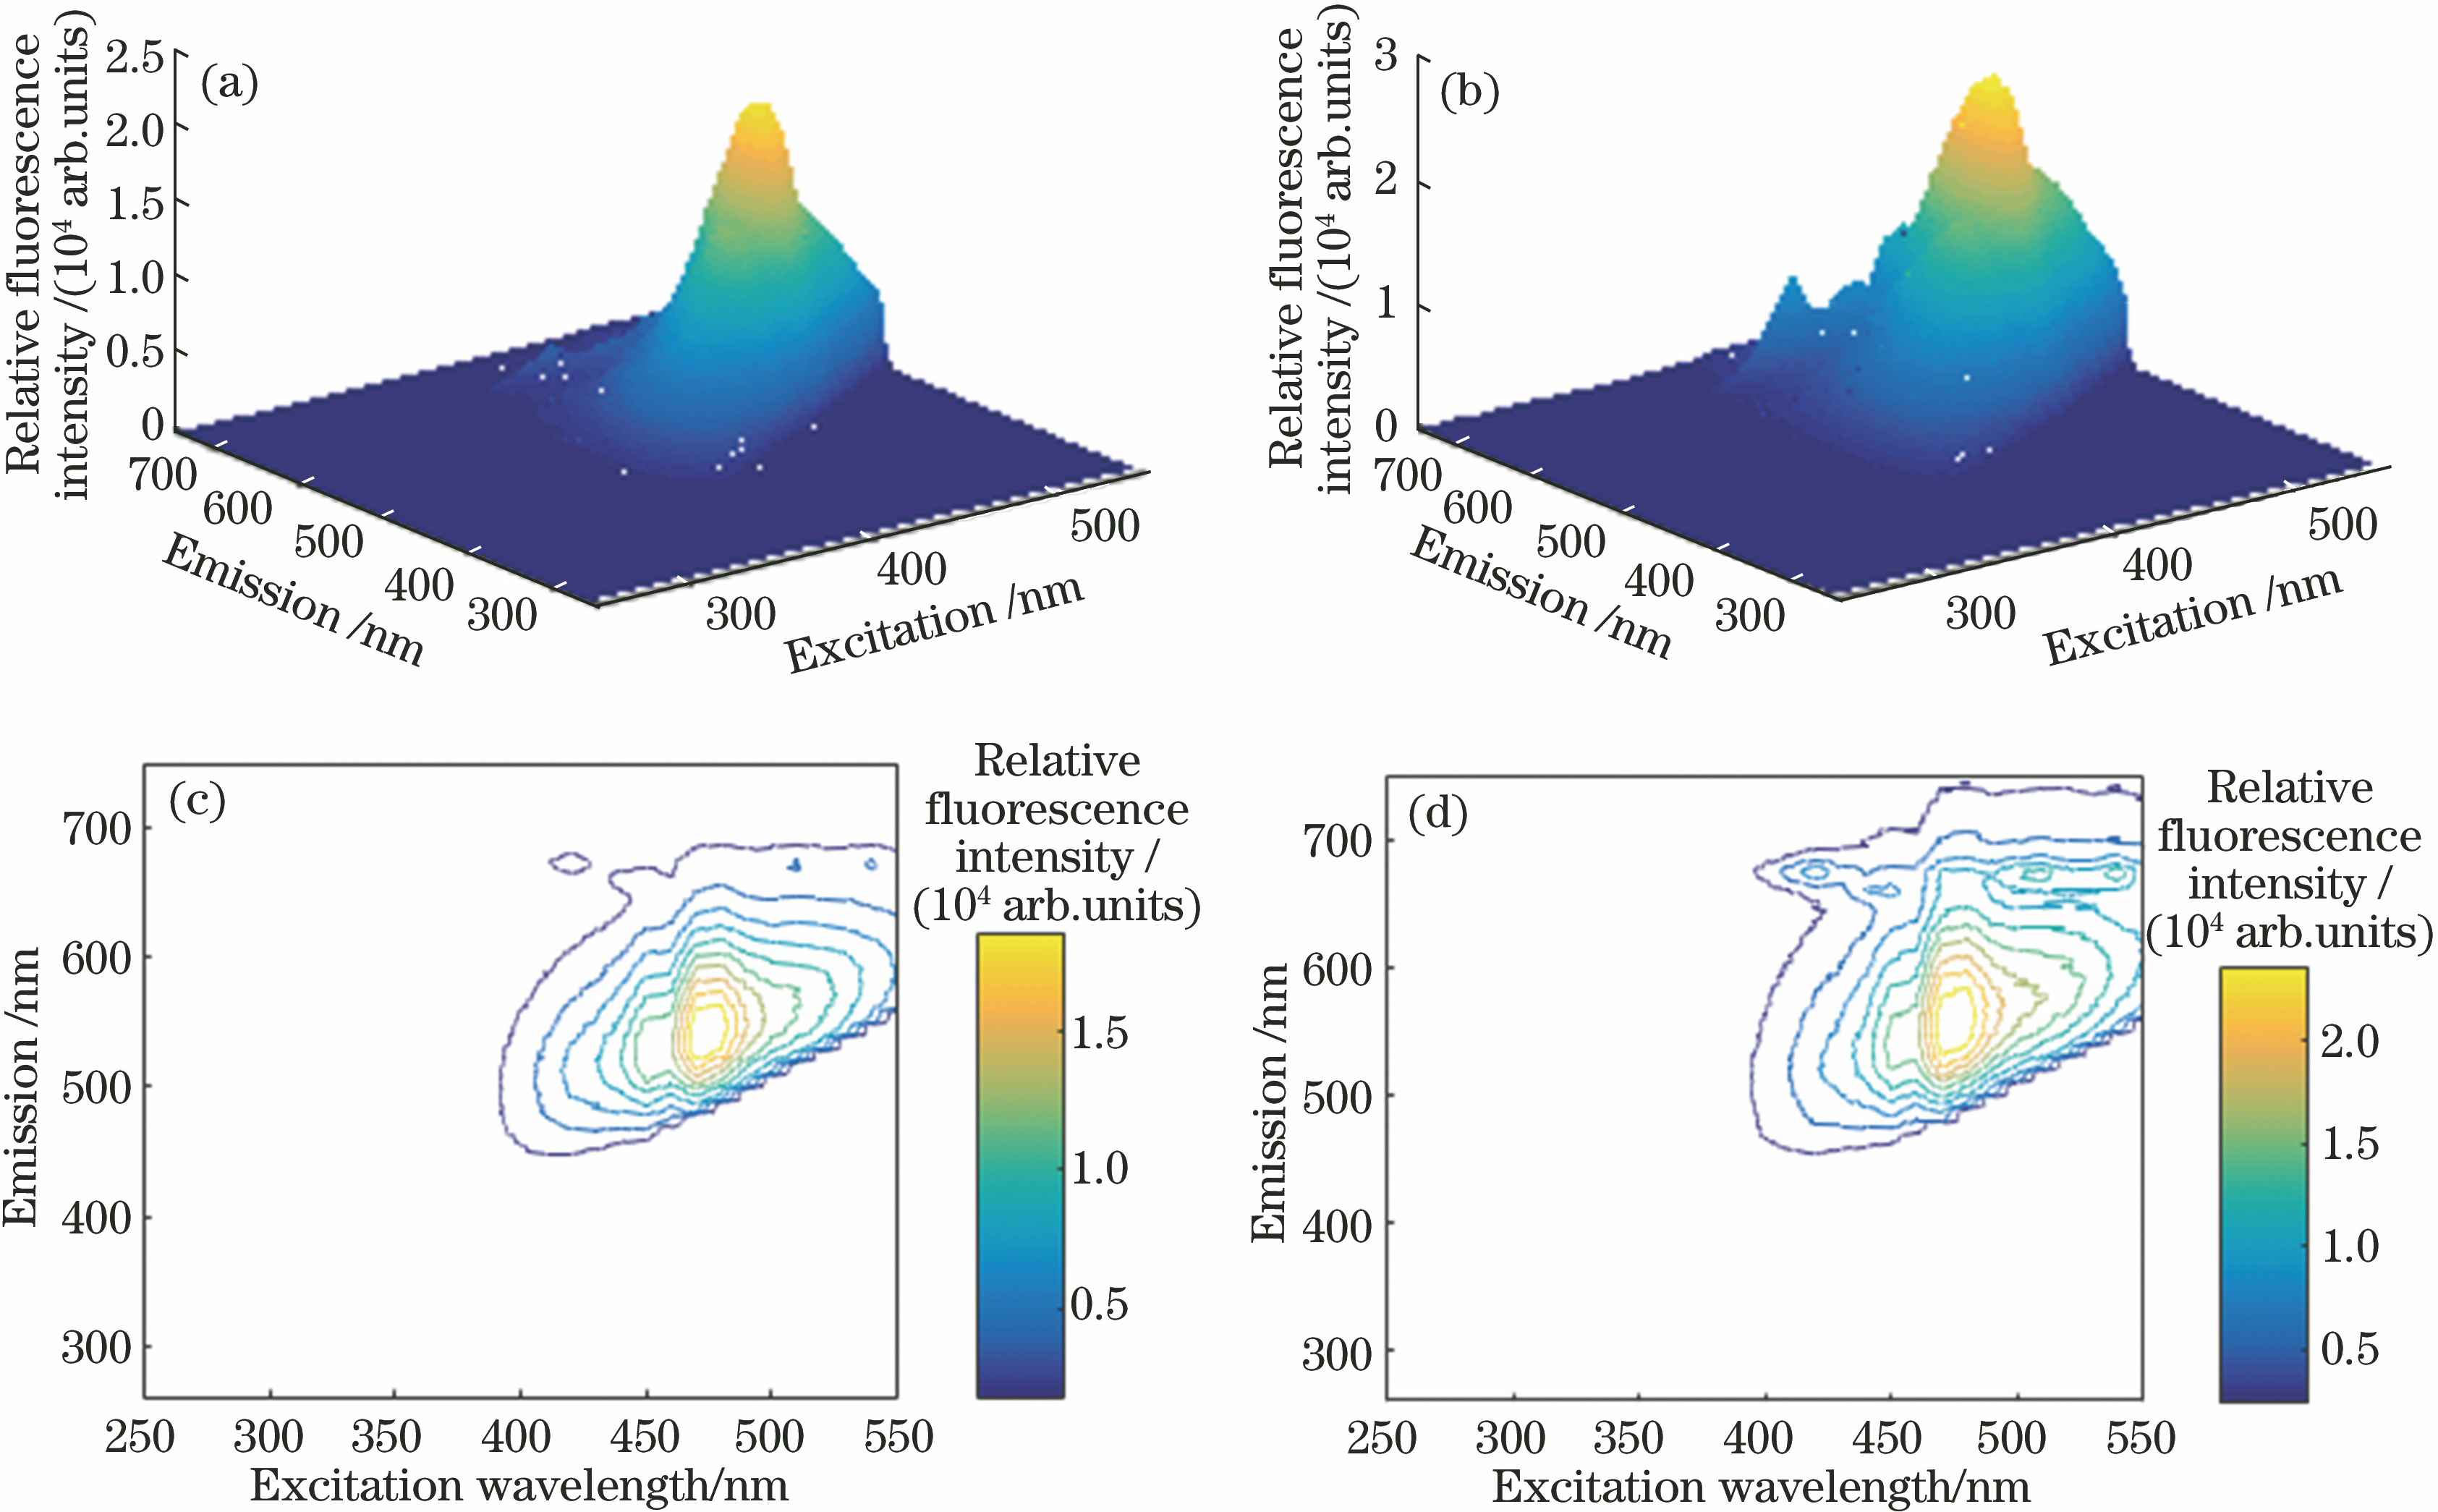
Fig. 1. Fluorescence spectra of original and corrected Z7 samples. (a) Original three-dimensional spectral map; (b) corrected three-dimensional spectral map; (c) original contour map; (d) corrected contour map
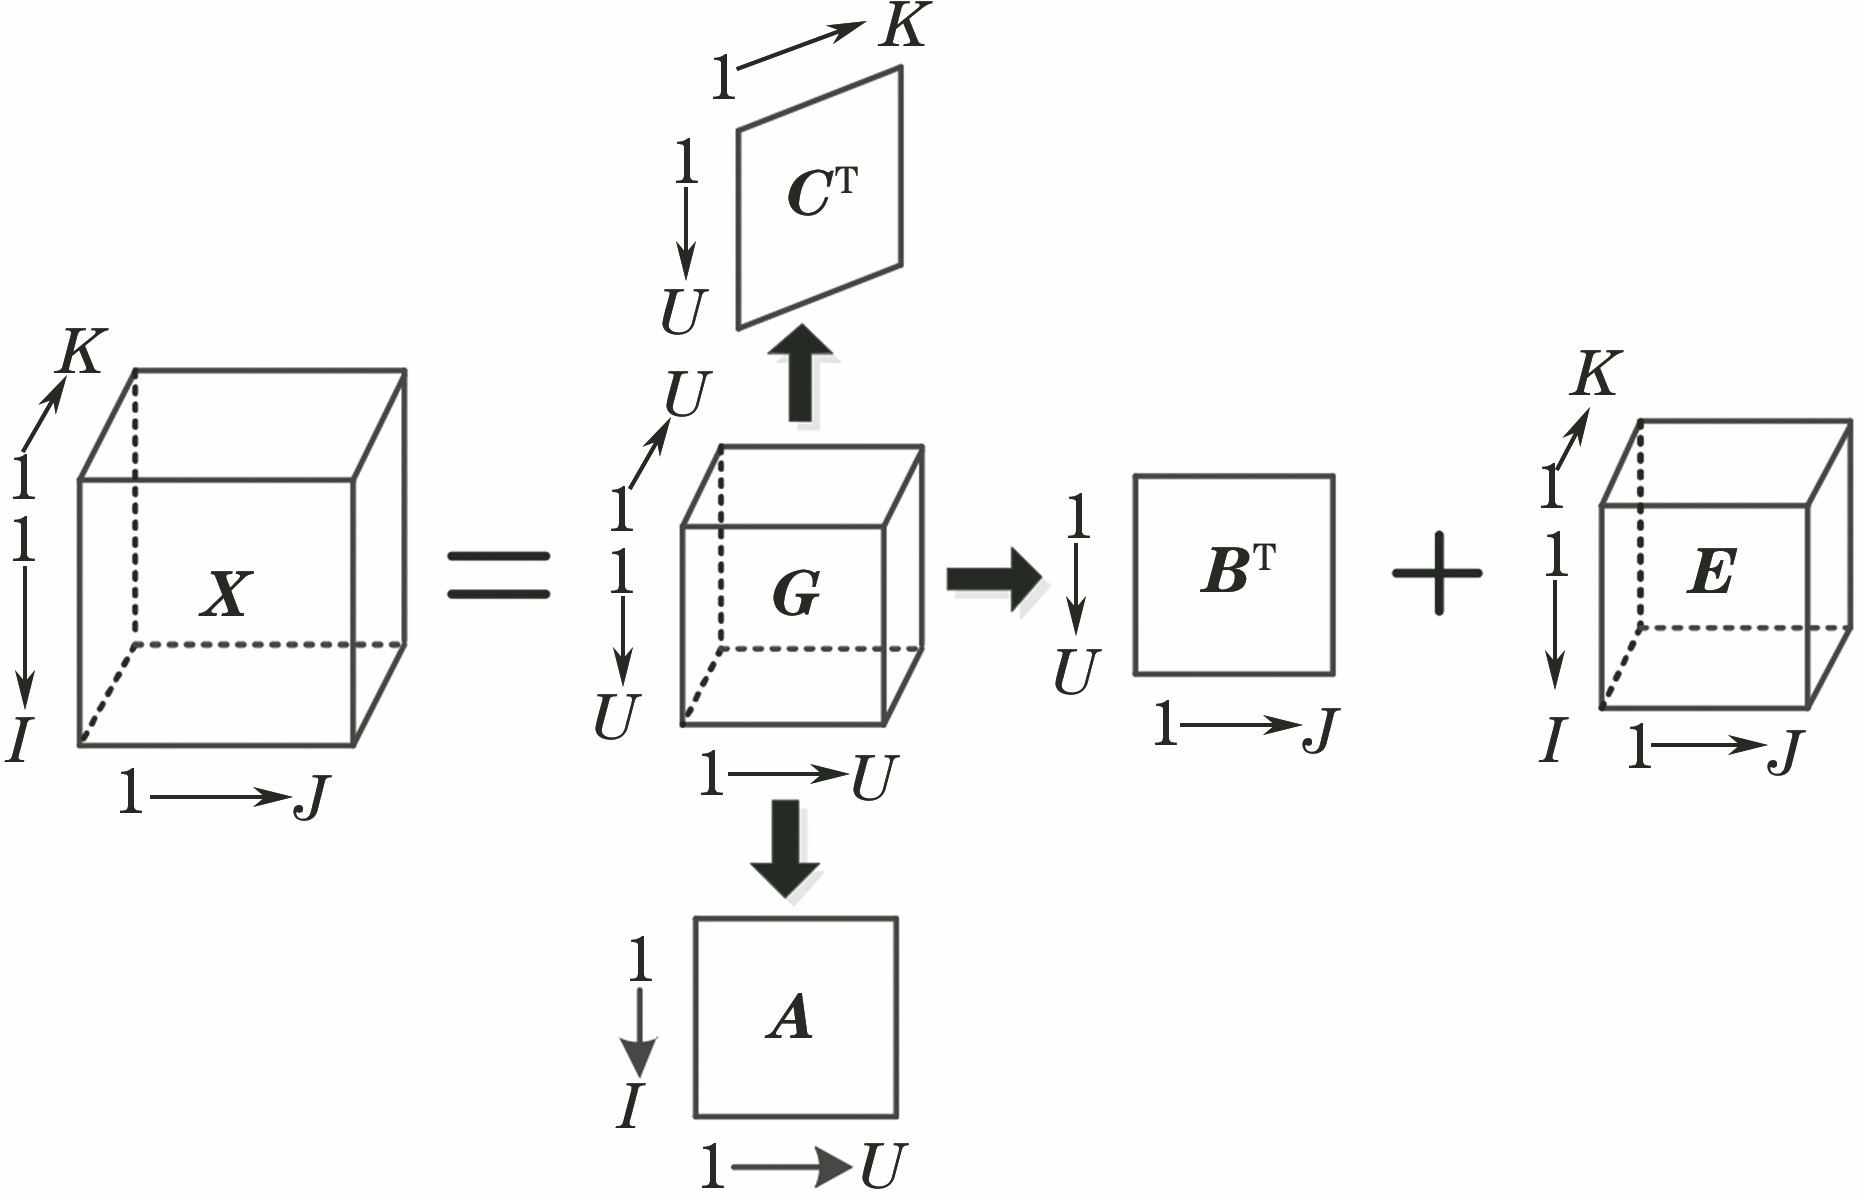
Fig. 2. Trilinear model
Fig. 3. Fluorescence spectral data of Z7 before and after compression. (a) Before compression; (b) after compression
Fig. 4. Partial emission spectra of Z7 before and after compression. (a1)-(a4) Before compression; (b1)-(b4) after compression
Fig. 5. Analytical results of Z7 and Z9 with APTLD algorithm. (a) Emission spectra; (b) excitation spectra
Fig. 6. Analytical results of Z7 and F6 with APTLD algorithm. (a) Emission spectra; (b) excitation spectra
Fig. 7. Analytical results of Z7 and F12 with APTLD algorithm. (a) Emission spectra; (b) excitation spectra
Fig. 8. Fitting curves between fluorescence intensity of each component obtained by APTLD algorithm and proportion of each component. (a) Sesame essence in F1-F7 and L1-L4 samples; (b) corn oil in F1-F7 and L1-L4 samples; (c) sesame essence in F8-F13 and L5-L8 samples; (d) rapeseed oil in F8-F13 and L5-L8 samples
|
Table 1. Brand of vegetable oil samples
|
Table 2. Proportion of each component in adulterated oil samples
|
Table 3. Compression results of several analytical samples
| |||||||||||||||||||||||||||||||||
Table 4. Predicted proportion and recovery rate of each component in adulterated sesame oil samples L1-L4
| |||||||||||||||||||||||||||||||||
Table 5. Predicted proportion and recovery rate of each component in adulterated sesame oil samples L5-L8

Set citation alerts for the article
Please enter your email address
© Copyright 2018-2021 | Chinese Laser Press. All Rights Reserved 沪ICP备15018463号-20