• Photonics Research
  • Vol. 7, Issue 8, 828 (2019)
Tiantian Li1、2, Milos Nedeljkovic1, Nannicha Hattasan1, Wei Cao1, Zhibo Qu1, Callum G. Littlejohns1、3, Jordi Soler Penades1, Lorenzo Mastronardi1, Vinita Mittal1, Daniel Benedikovic4, David J. Thomson1, Frederic Y. Gardes1, Hequan Wu2, Zhiping Zhou2, and Goran Z. Mashanovich1、*
Author Affiliations
  • 1Optoelectronics Research Centre, University of Southampton, Southampton SO17 1BJ, UK
  • 2State Key Laboratory of Advanced Optical Communication Systems and Networks, School of Electronics Engineering and Computer Science, Peking University, Beijing 100871, China
  • 3Silicon Technologies Centre of Excellence, Nanyang Technological University, Singapore 639798, Singapore
  • 4Centre de Nanosciences et de Nanotechnologies, CNRS, Univ. Paris-Sud, Université Paris-Saclay, C2N—Palaiseau, 91120 Palaiseau, France
  • show less
    DOI: 10.1364/PRJ.7.000828 Cite this Article Set citation alerts
    Tiantian Li, Milos Nedeljkovic, Nannicha Hattasan, Wei Cao, Zhibo Qu, Callum G. Littlejohns, Jordi Soler Penades, Lorenzo Mastronardi, Vinita Mittal, Daniel Benedikovic, David J. Thomson, Frederic Y. Gardes, Hequan Wu, Zhiping Zhou, Goran Z. Mashanovich. Ge-on-Si modulators operating at mid-infrared wavelengths up to 8  μm[J]. Photonics Research, 2019, 7(8): 828 Copy Citation Text show less
    (a) Schematic of the PIN junction modulator cross section. (b) The mode profiles for Ge-on-Si rib waveguides at 3.8 and 8 μm wavelengths, modeled using Lumerical Mode Solutions.
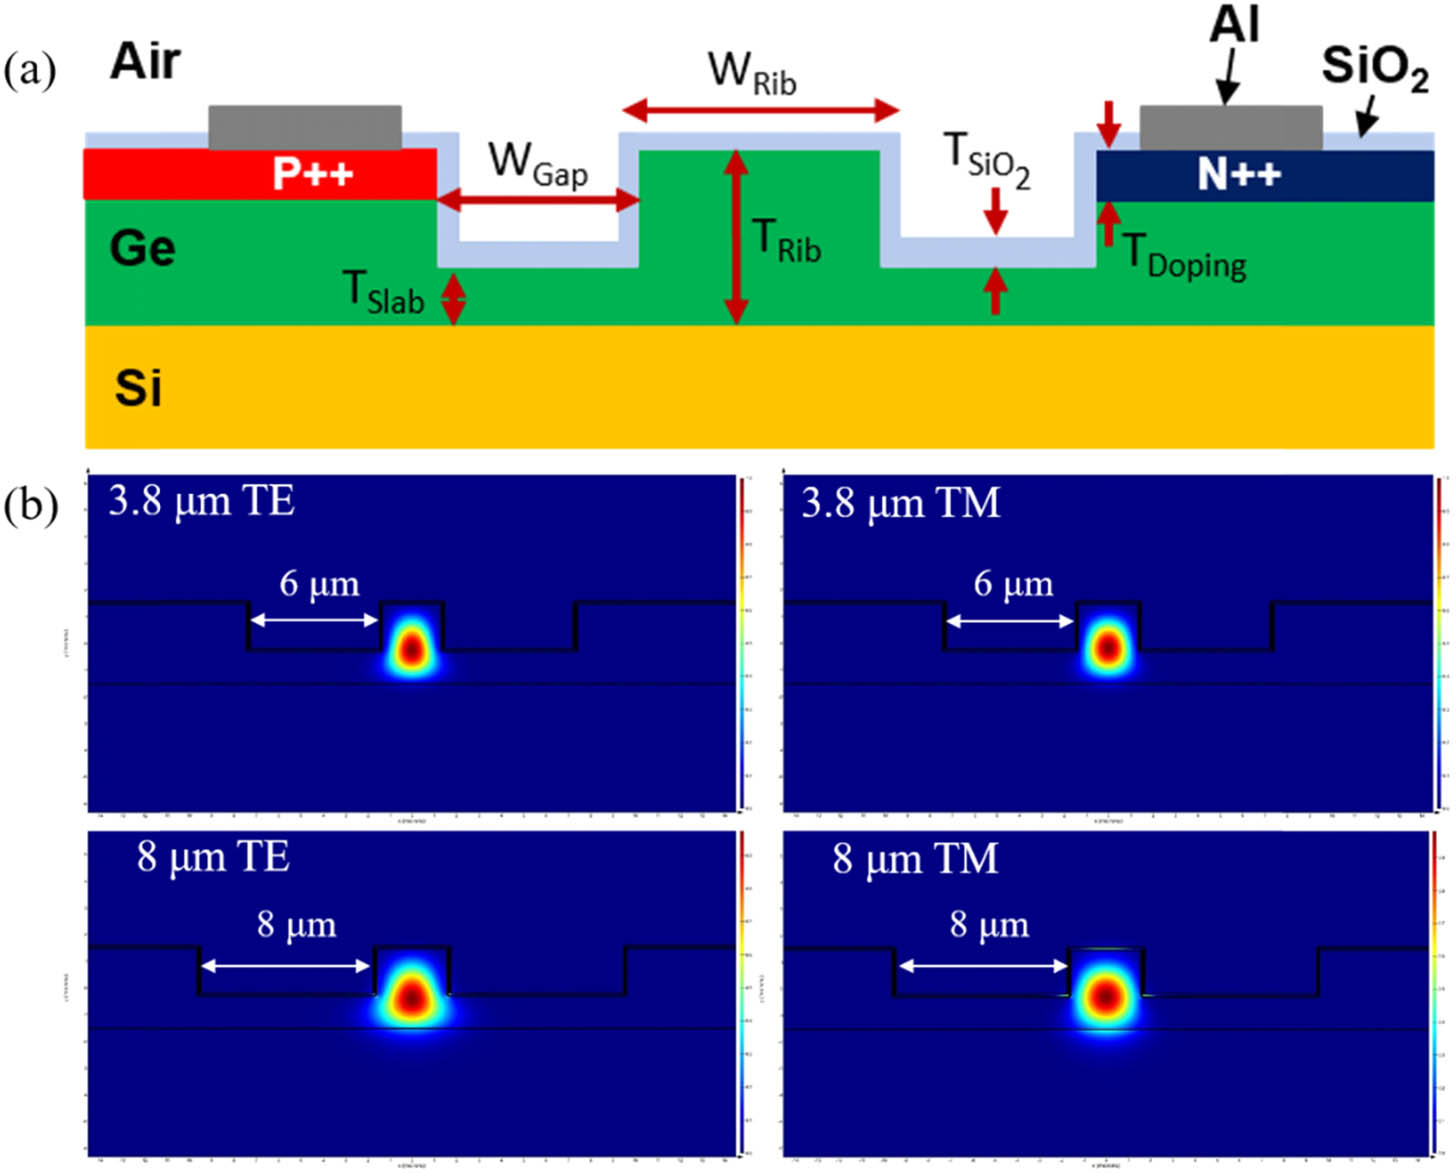
    Fig. 1. (a) Schematic of the PIN junction modulator cross section. (b) The mode profiles for Ge-on-Si rib waveguides at 3.8 and 8 μm wavelengths, modeled using Lumerical Mode Solutions.
    Schematic illustration of the process flow used for the fabrication of Ge-on-Si waveguide modulators.
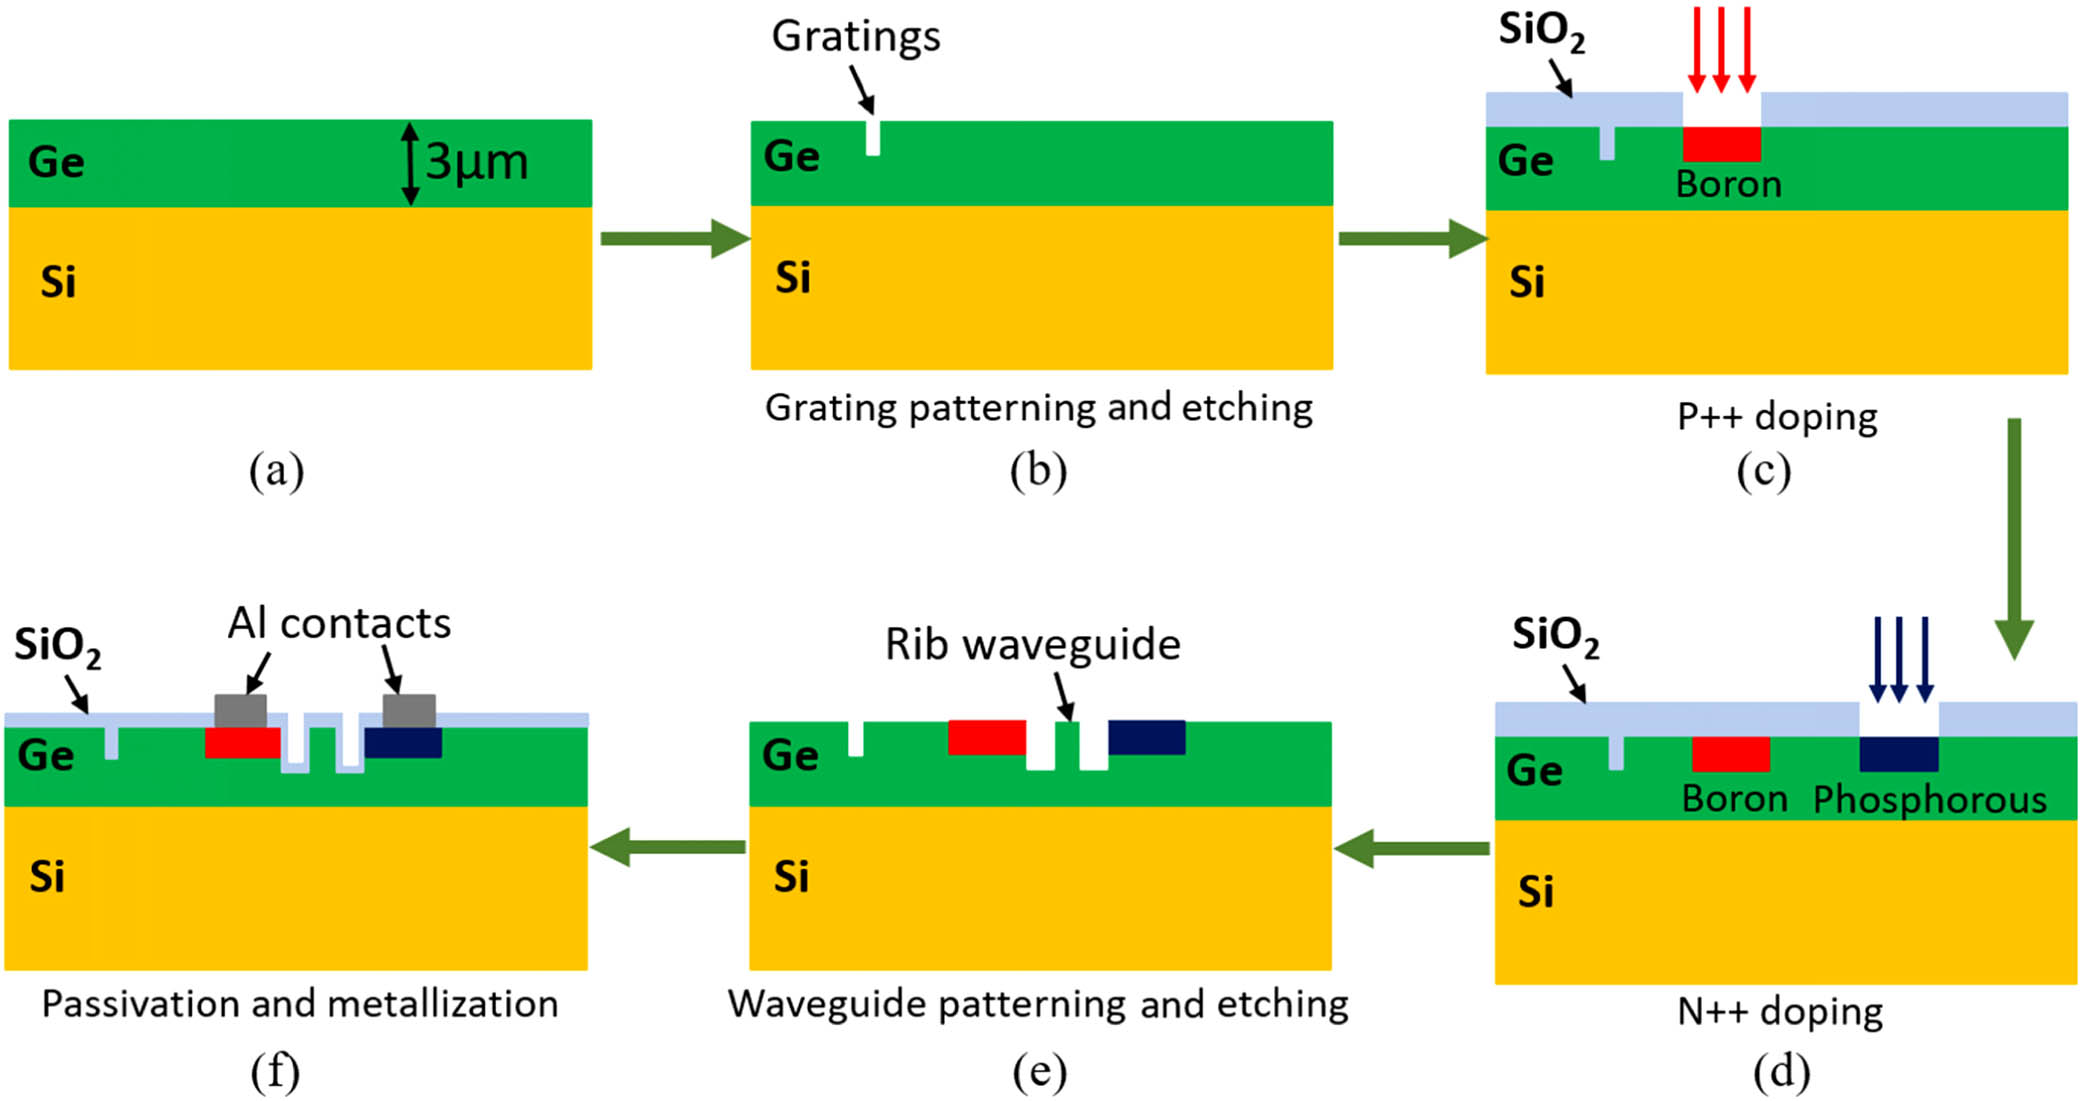
    Fig. 2. Schematic illustration of the process flow used for the fabrication of Ge-on-Si waveguide modulators.
    Optical microscope images of the EAM devices at 3.8 μm. The image is composed of two images that have been stitched together, since the 1-mm PIN diode length does not fit in the microscope field of view. The horizontal white strip near the middle of the figure separates the two parts.
    Fig. 3. Optical microscope images of the EAM devices at 3.8 μm. The image is composed of two images that have been stitched together, since the 1-mm PIN diode length does not fit in the microscope field of view. The horizontal white strip near the middle of the figure separates the two parts.
    Top view scanning electron microscope image of the PIN diode. The waveguide and etched lateral cladding are in the middle of the image in grey. The blue shaded region on the left is N++ doped, while the red region on the right is P++ doped. On both the P++- and N++-doped side regions, rough surfaces are visible, the areas in which vias through the SiO2 top cladding have been etched for the formation of Ohmic contacts.
    Fig. 4. Top view scanning electron microscope image of the PIN diode. The waveguide and etched lateral cladding are in the middle of the image in grey. The blue shaded region on the left is N++ doped, while the red region on the right is P++ doped. On both the P++- and N++-doped side regions, rough surfaces are visible, the areas in which vias through the SiO2 top cladding have been etched for the formation of Ohmic contacts.
    Schematic diagram of the experimental setup for modulator characterization (PPG, pulse pattern generator).
    Fig. 5. Schematic diagram of the experimental setup for modulator characterization (PPG, pulse pattern generator).
    (a) Modulation depth as a function of the wavelength under different bias conditions. (b) Modulation depth as a function of current at a wavelength of 3765 nm. Inset: current-voltage device characteristic.
    Fig. 6. (a) Modulation depth as a function of the wavelength under different bias conditions. (b) Modulation depth as a function of current at a wavelength of 3765 nm. Inset: current-voltage device characteristic.
    (a) Optical spectra of the MZM under several DC voltages. The spectral transmission is normalized to the highest transmission as seen through the device (so that the offset of transmission from zero does not represent the insertion loss). (b) Phase shift versus current of the MZM.
    Fig. 7. (a) Optical spectra of the MZM under several DC voltages. The spectral transmission is normalized to the highest transmission as seen through the device (so that the offset of transmission from zero does not represent the insertion loss). (b) Phase shift versus current of the MZM.
    Eye diagrams measured at 60 MHz for (a) EAM and (b) MZM.
    Fig. 8. Eye diagrams measured at 60 MHz for (a) EAM and (b) MZM.
    Captured LWIR camera image with the QCL tuned to λ=8 μm: (a) when the laser is emitting, (b) when the “laser off” frame is subtracted from the “laser on” frame. White areas show high infrared light intensity, and dark areas show low intensity.
    Fig. 9. Captured LWIR camera image with the QCL tuned to λ=8  μm: (a) when the laser is emitting, (b) when the “laser off” frame is subtracted from the “laser on” frame. White areas show high infrared light intensity, and dark areas show low intensity.
    (a) Extinction ratio as a function of the applied voltage for a 2-mm-long EAM operating at a wavelength of 8 μm. Inset: current per unit length versus voltage curves at a wavelength of 8 μm (2-mm-long diode) and of 3.8 μm (1-mm-long diode) for EAM devices with the same 8-μm contact separation (WGap). (b) Absorption coefficient versus current per unit PIN diode length at a wavelength of 8 μm (2-mm-long diode) and of 3.8 μm (1-mm-long diode) for EAM devices with the same contact separation (WGap).
    Fig. 10. (a) Extinction ratio as a function of the applied voltage for a 2-mm-long EAM operating at a wavelength of 8 μm. Inset: current per unit length versus voltage curves at a wavelength of 8 μm (2-mm-long diode) and of 3.8 μm (1-mm-long diode) for EAM devices with the same 8-μm contact separation (WGap). (b) Absorption coefficient versus current per unit PIN diode length at a wavelength of 8 μm (2-mm-long diode) and of 3.8 μm (1-mm-long diode) for EAM devices with the same contact separation (WGap).
    Tiantian Li, Milos Nedeljkovic, Nannicha Hattasan, Wei Cao, Zhibo Qu, Callum G. Littlejohns, Jordi Soler Penades, Lorenzo Mastronardi, Vinita Mittal, Daniel Benedikovic, David J. Thomson, Frederic Y. Gardes, Hequan Wu, Zhiping Zhou, Goran Z. Mashanovich. Ge-on-Si modulators operating at mid-infrared wavelengths up to 8  μm[J]. Photonics Research, 2019, 7(8): 828
    Download Citation