
Jianrong Qiu, Chen Yang, Cheng Zhang, Jia Meng, Tao Han, Huanghe Qian, Peizhe Chen, Lu Yang, Zhiyi Liu, Zhihua Ding. Optimization of Large-Core-Fiber-Based Fiber Probe for Optical Coherence Tomography[J]. Chinese Journal of Lasers, 2022, 49(20): 2007201
- Chinese Journal of Lasers
- Vol. 49, Issue 20, 2007201 (2022)
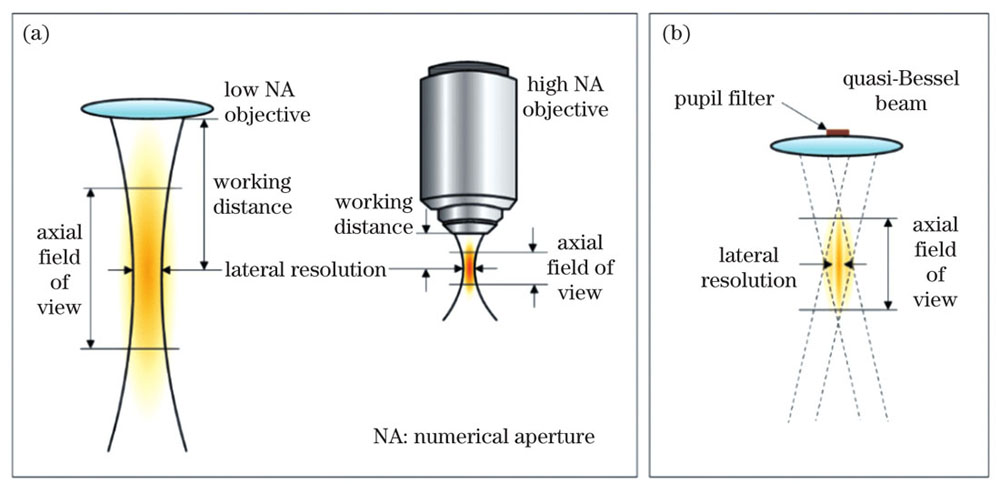
Fig. 1. Lateral resolution, axial field of view, and working distance of optical coherence tomography (OCT) system. (a) Gaussian beams under low NA focusing and high NA focusing; (b) light focusing with spatial pupil filter
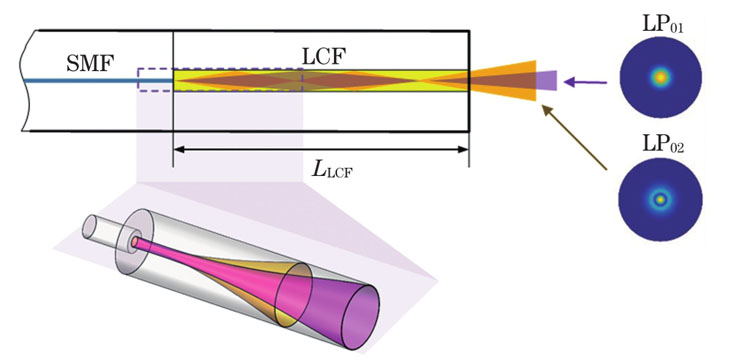
Fig. 2. Spatial filter based on large-core-fiber (LCF) ( only skew rays from a single annular area from SMF are depicted in the below panel demonstrating three-dimensional light rays; SMF: single mode fiber; NCF: no core fiber)
Fig. 3. Two working modes of LCF-based probes and relay of light beam. (a) Lens-free mode, where the output beam is regulated directly by LCF; (b) spatial filtering mode, where the output beam is regulated indirectly by LCF through controlling light field on the entrance pupil of the objective (GIF); (c)(d) output beams from LCF or GIF are relayed to the outside of probe by the lens (GIF2)
Fig. 4. Beam simulation method by eigen mode expansion
Fig. 5. Schematic of probe-OCT system
Fig. 6. Controllable output beam under lens-free mode[19]. (a) Tapered-LCF-based probe; (b) mode power regulated by the length of tapering length; (c) intensity distributions of output beams under different probe parameters
Fig. 7. Probe with a fiber spatial filter and extended DOF[18], where the boxes with yellow and white colors represent fiber cores. (a) Schematic of probe; (b) light intensity distribution of probe with spatial filter; (c) light intensity distribution of traditional probe without filter
Fig. 8. Influence of fiber length error of each fiber in the probe with filter on probe performance[18]. (a) GIF; (b) LCF; (c) NCF; (d) GIF2 (where Y-axis represents specifications ratio between the probe with fabrication errors and the probe without fabrication error, and DOFG, MBD, and WD represent relative values of DOF gain, minimal beam diameter, and working distance, respectively)
Fig. 9. Schematic of probe with a mode interference field expanded by imaging[20]
Fig. 10. Light intensity distributions of output beams from probes with mode interference fields expanded by two different ways[20]
Fig. 11. Microscopy images of fabricated probes and OCT imaging of fresh lemon under the probes[20], where the yellow arrows indicate the end facets of the probes and the light blue dotted boxes represent the axial field of views. (a) Probe with a filter based on imaging expansion; (b) traditional probe without filter
Fig. 12. Probe designs with different mode numbers and mode power distributions. (a) Probe with dual-mode interference;(b) probe with lower-order-multimode interference; (c) probe with higher-order-multimode interference
Fig. 13. Light intensity distribution and parameters comparisons between output beam from the probe with higher-order-multimode interference and Gaussian beam with a same MBD. (a) Light intensity distribution of output beam from the probe with higher-order-multimode interference; (b) axial light intensity curve; (c)(d) curve between axial positions and lateral resolution and zoom in view of the boxed area; (e) lateral intensity curves at the working distance
|
Table 1. Parameters of output beams from lens-free probes Ⅰ and Ⅲ
|
Table 2. Parameters of output beams from probes with and without filter
|
Table 3. Output beams parameters from probes with mode interference fields expanded by imaging and by diffraction
|
Table 4. Optimized output beams parameters from the probes with lower-order-multimode interference and higher-order-multimode interference
|
Table 5. Effects of work modes, being free of beam relay or not, and the number of fiber mode on optimized result of probes

Set citation alerts for the article
Please enter your email address
© Copyright 2018-2021 | Chinese Laser Press. All Rights Reserved 沪ICP备15018463号-20