
Tianyu Chen, Mingdi Wang, Guilin Yang, Kai Liu, Keming Shi. Removal of Cable Shield Material by YAG Laser[J]. Acta Optica Sinica, 2017, 37(12): 1214002
- Acta Optica Sinica
- Vol. 37, Issue 12, 1214002 (2017)
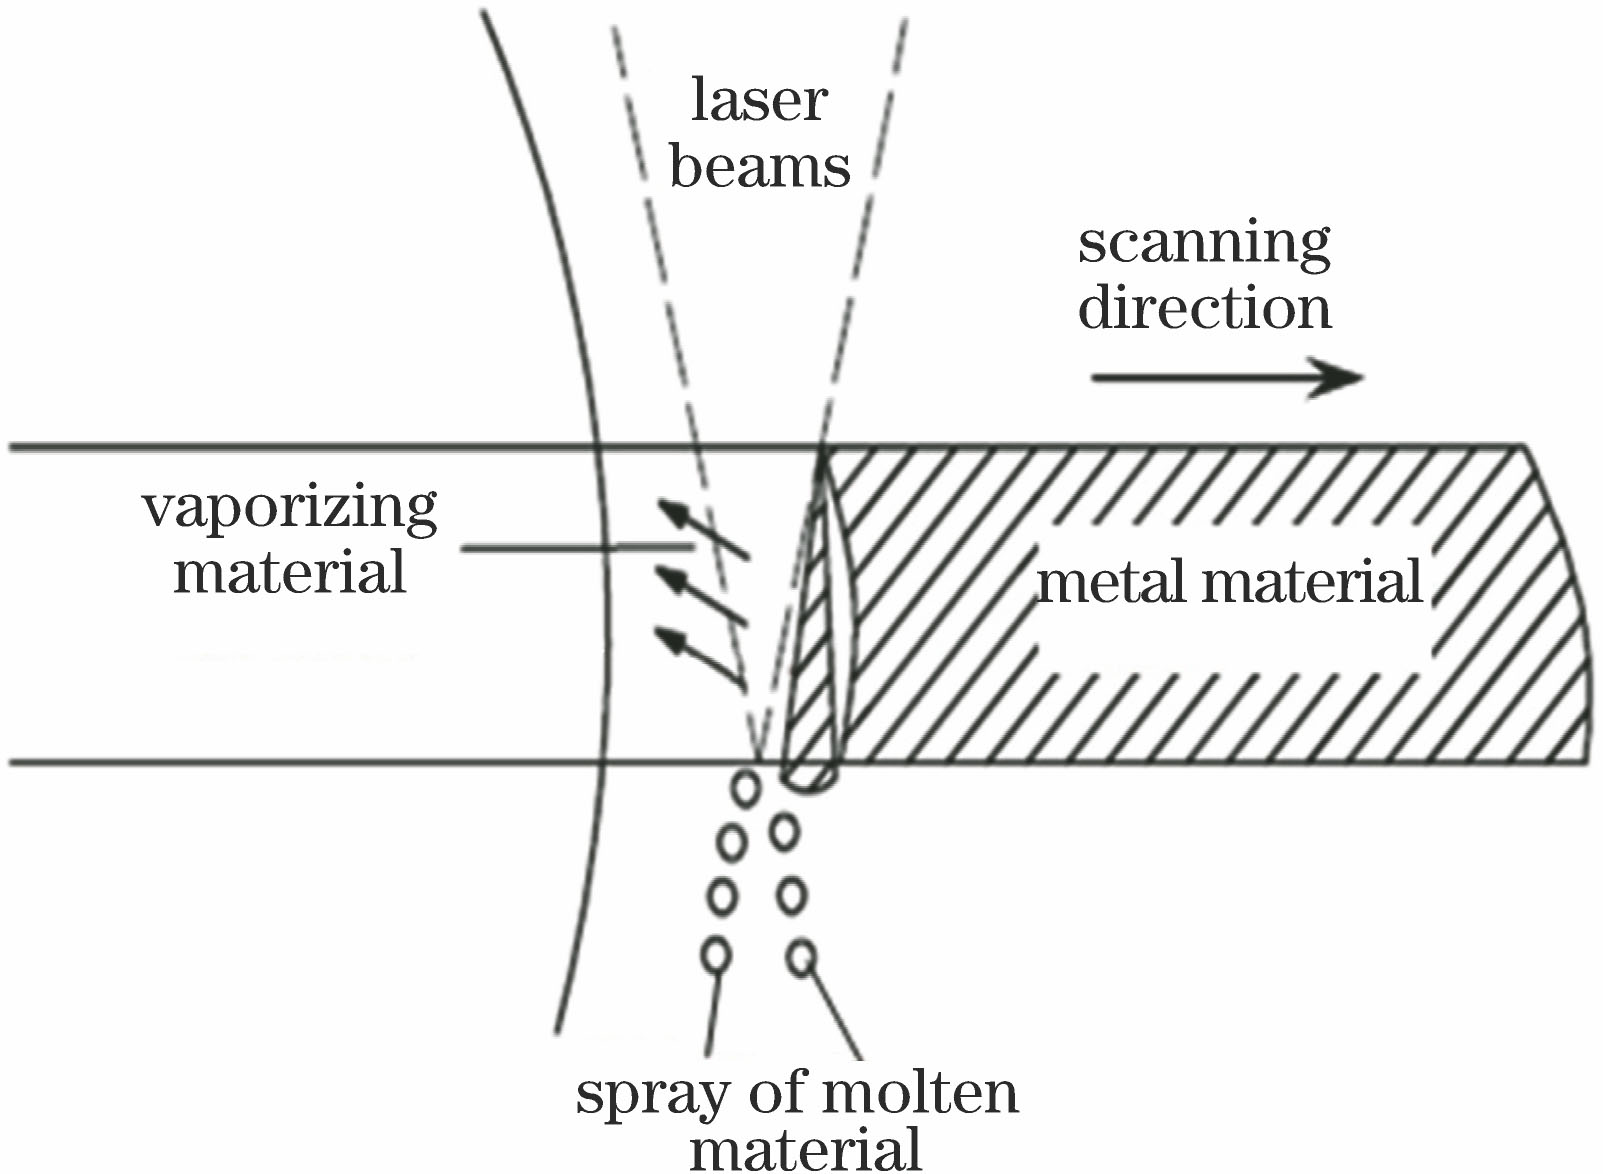
Fig. 1. Model of laser peeling of metallic materials
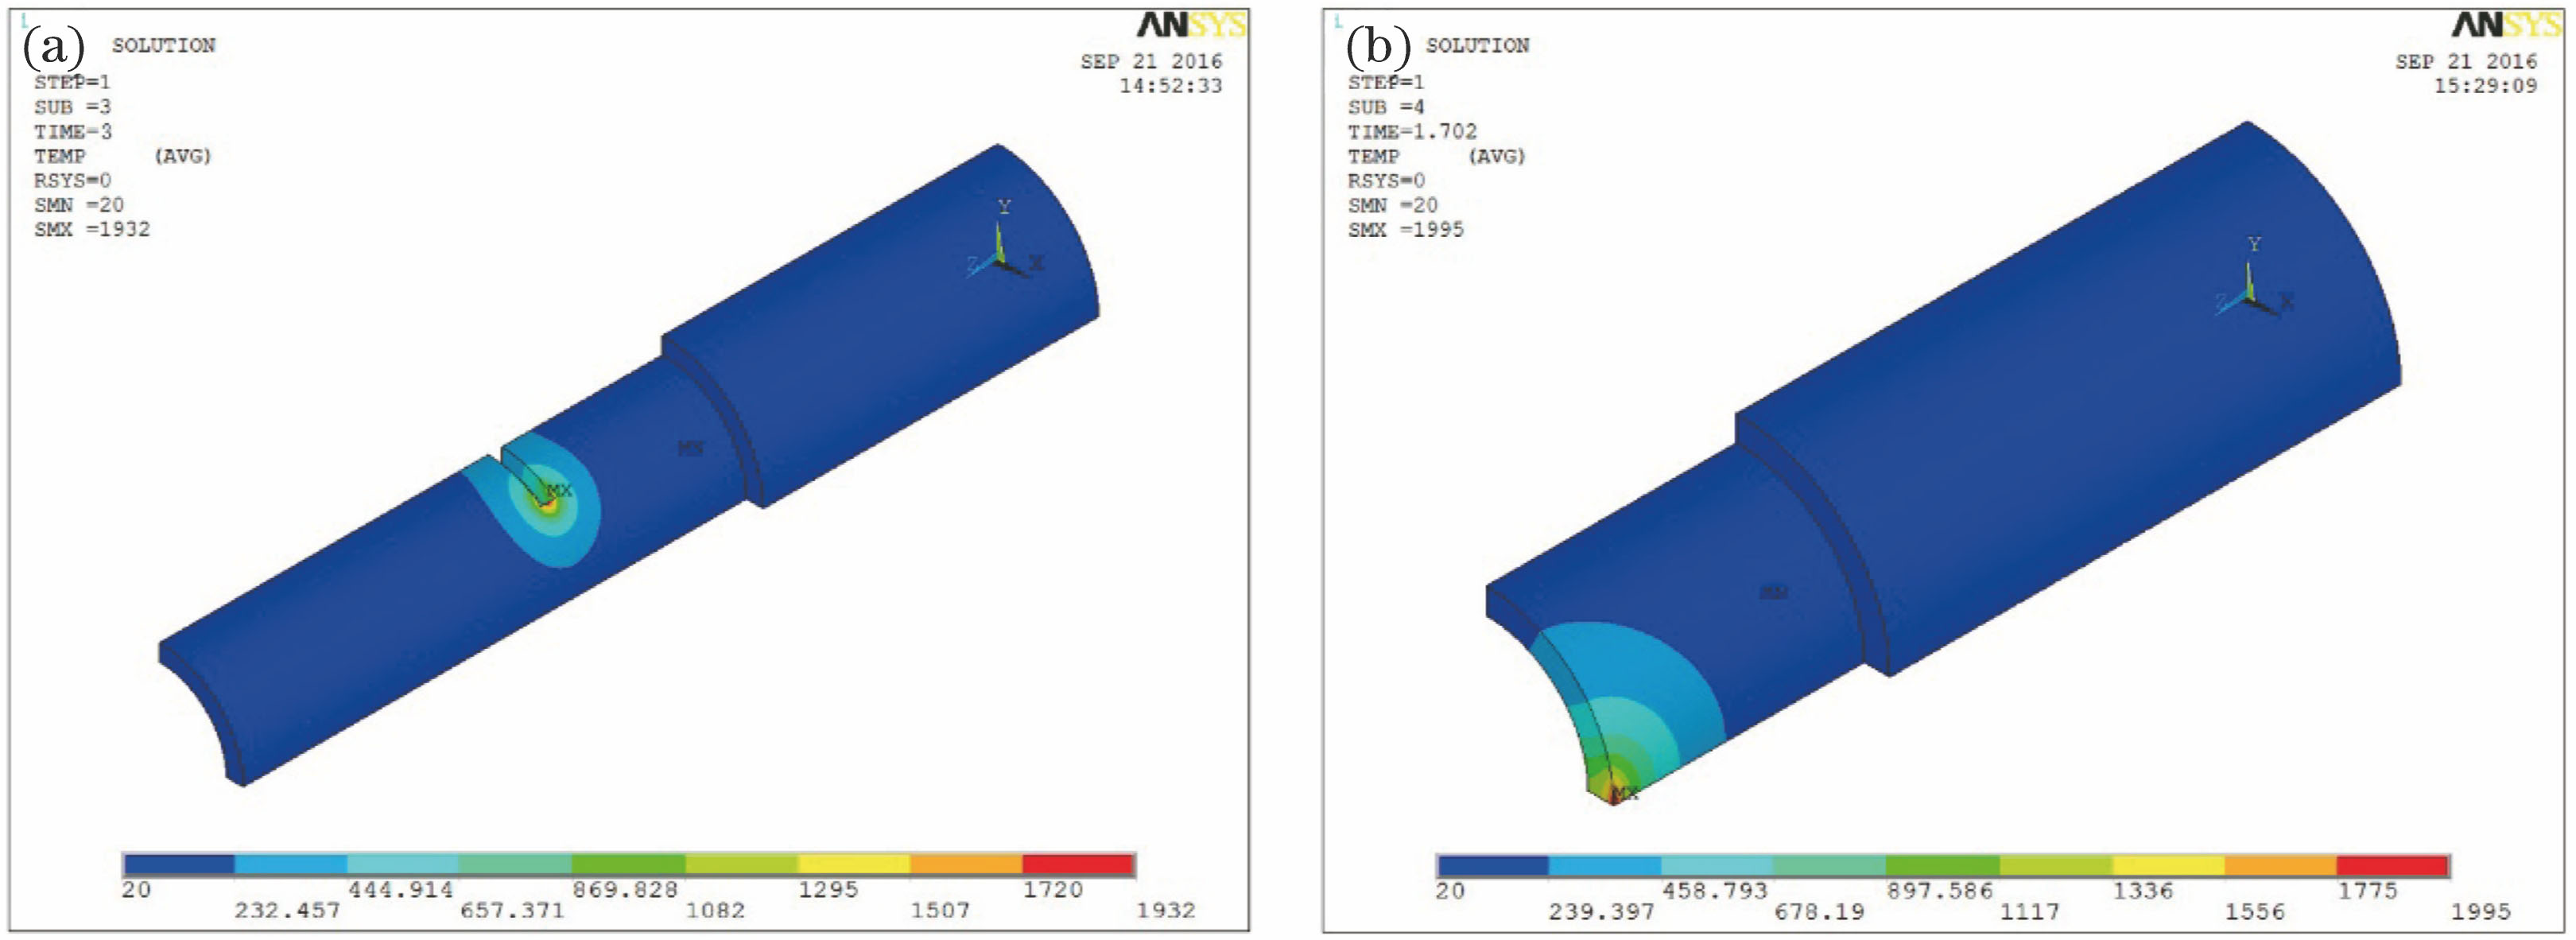
Fig. 2. Cloud pictures of temperature field in shielding layer. (a) Temperature field in quasi-steady state; (b) longitudinal distribution of temperature field
Fig. 3. Influence of laser power on peeling quality of shielding layer
Fig. 4. Influence of laser scanning speed on peeling quality of shielding layer
Fig. 5. Influence of laser frequency on peeling quality of shielding layer
Fig. 6. Influence of defocusing distance on peeling quality of shielding layer
Fig. 7. (a) Effect picture and (b) kerf surface of laser peeling of shielding layers after laser parameter optimization
|
Table 1. Process parameters and test results for laser peeling of shielding layers
| ||||||||||||||||||||||||
Table 2. Factor level table
| |||||||||||||||||||||||||||||||||||||||||||||||||||||||||||||||||||||||||||||||||||||||
Table 3. Arrangement of orthogonal test elements and results
| |||||||||||||||||||||||||||||
Table 4. Range analysis results of kerf widths
| |||||||||||||||||||||||||||||
Table 5. Range analysis results of kerf depths

Set citation alerts for the article
Please enter your email address
© Copyright 2018-2021 | Chinese Laser Press. All Rights Reserved 沪ICP备15018463号-20