Author Affiliations
School of Information and Control Engineering, China University of Mining and Technology, Xuzhou, Jiangsu 221116, Chinashow less
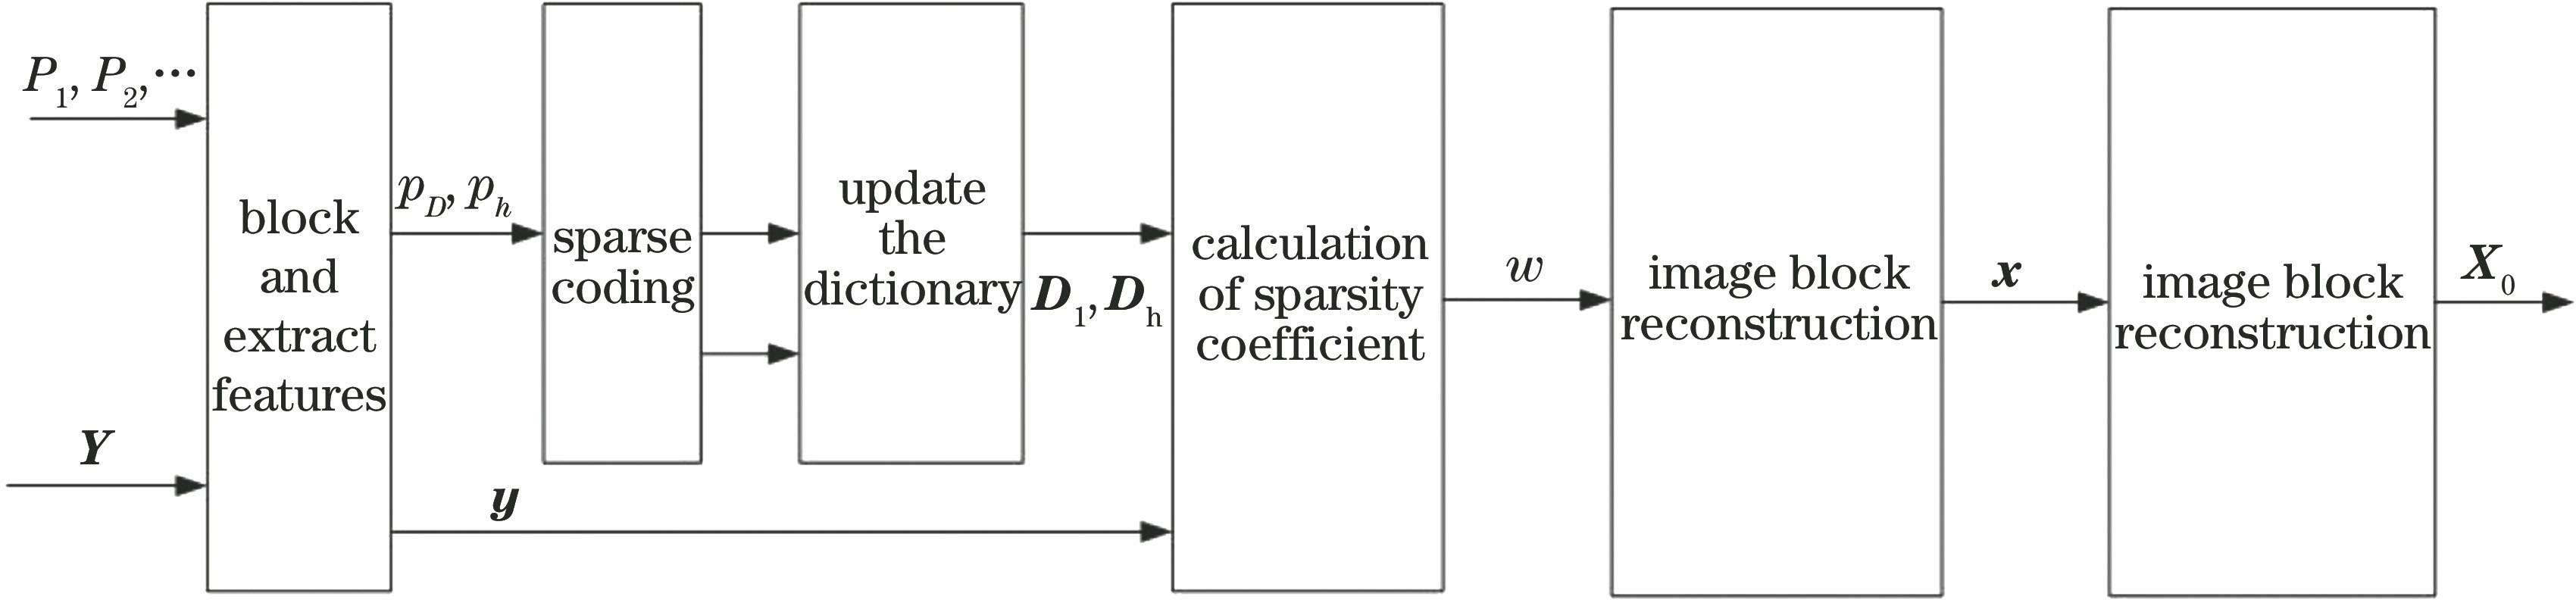
Fig. 1. Super-resolution reconstruction based on sparse encoding
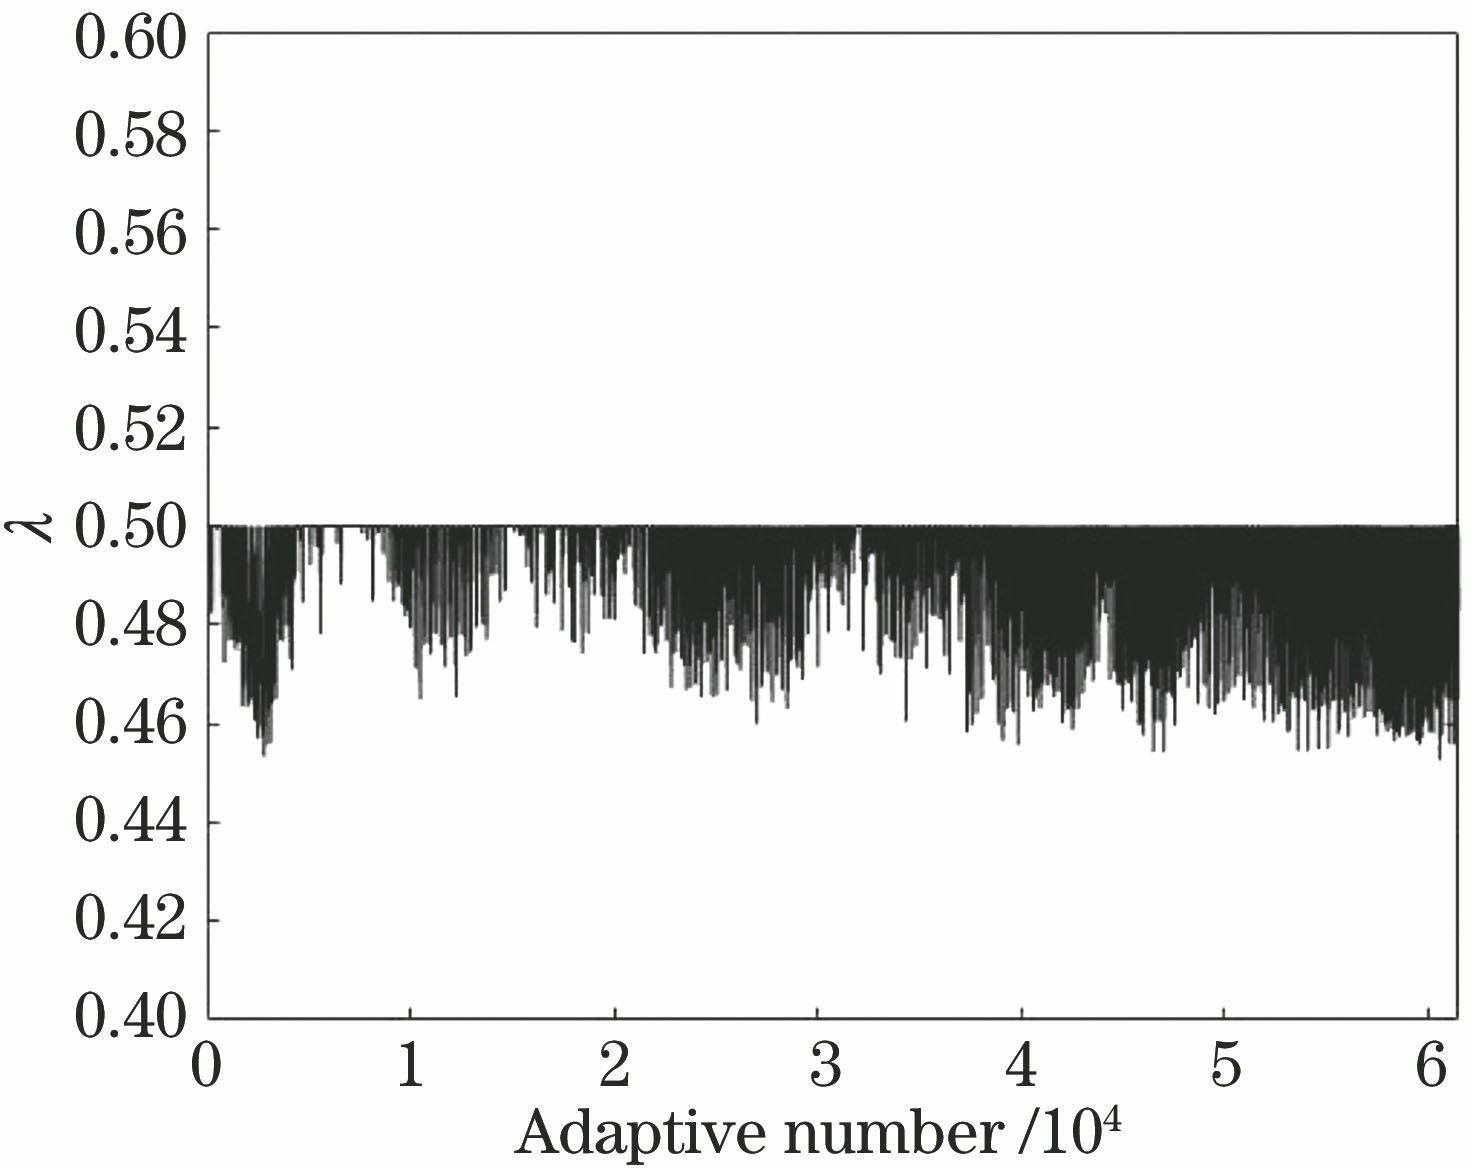
Fig. 2. Visualization of adaptive value for the image of Lenna
Fig. 3. Comparison of reconstruction for different images when the magnification factor is 2. (a) Baby; (b Lenna; (c) butterfly
Fig. 4. Comparison of reconstruction for image of baby when the magnification factor is 3
Fig. 5. Comparison of reconstruction for image of baby when the magnification factor is 4
Fig. 6. Comparison of reconstruction under Gaussian noise environment with variance of 0.0005
Fig. 7. Comparison of reconstruction under pepper & salt noise environment with density of 0.001
| Method | Evaluation index | Baby | Lenna | Butterfly | Subway | Man | Bike | Baboon | Monarch |
|---|
| RMSE | 4.157 | 5.455 | 12.572 | 10.009 | 10.213 | 15.479 | 17.337 | 6.673 | | Bicubic | PSNR | 37.059 | 34.713 | 27.462 | 29.440 | 29.261 | 25.657 | 24.674 | 32.958 | | SSIM | 0.951 | 0.911 | 0.915 | 0.871 | 0.845 | 0.850 | 0.696 | 0.959 | | RMSE | 4.622 | 12.108 | 15.991 | 11.624 | 10.926 | 21.070 | 19.442 | 7.543 | | NE | PSNR | 36.889 | 28.669 | 26.559 | 27.416 | 28.291 | 21.657 | 22.589 | 31.211 | | SSIM | 0.893 | 0.788 | 0.737 | 0.753 | 0.786 | 0.591 | 0.505 | 0.882 | | RMSE | 3.601 | 4.561 | 7.836 | 8.623 | 8.863 | 11.357 | 16.157 | 4.701 | | Ours1 | PSNR | 38.384 | 36.299 | 31.572 | 30.802 | 30.500 | 28.401 | 25.286 | 36.031 | | SSIM | 0.963 | 0.927 | 0.958 | 0.908 | 0.880 | 0.914 | 0.759 | 0.970 | | RMSE | 3.603 | 4.574 | 7.845 | 8.520 | 8.881 | 11.486 | 16.141 | 4.718 | | Ours2 | PSNR | 38.351 | 36.276 | 31.562 | 30.846 | 30.483 | 28.322 | 25.295 | 35.996 | | SSIM | 0.963 | 0.926 | 0.958 | 0.909 | 0.880 | 0.9127 | 0.759 | 0.971 | | RMSE | 3.605 | 4.571 | 7.843 | 8.564 | 8.854 | 11.414 | 16.148 | 4.675 | | Ours3 | PSNR | 38.360 | 36.280 | 31.563 | 30.850 | 30.508 | 28.353 | 25.291 | 36.079 | | SSIM | 0.963 | 0.926 | 0.958 | 0.910 | 0.880 | 0.914 | 0.760 | 0.971 |
|
Table 1. Numerical comparison of reconstruction for different images when the magnification factor is 2
| Method | Evaluation index | Baby | Lenna | Butterfly | Subway | Man | Bike | Baboon | Monarch |
|---|
| RMSE | 3.656 | 4.631 | 7.911 | 8.696 | 8.885 | 11.619 | 16.218 | 5.145 | | ScSr1[14] | PSNR | 38.262 | 36.215 | 31.502 | 30.707 | 30.484 | 28.207 | 25.269 | 35.300 | | SSIM | 0.961 | 0.925 | 0.956 | 0.906 | 0.878 | 0.910 | 0.757 | 0.967 | | RMSE | 3.633 | 4.593 | 7.884 | 8.672 | 8.866 | 11.594 | 16.185 | 5.104 | | ODL1[17] | PSNR | 38.270 | 36.239 | 31.518 | 30.738 | 30.497 | 28.226 | 25.272 | 35.309 | | SSIM | 0.962 | 0.926 | 0.957 | 0.907 | 0.879 | 0.911 | 0.758 | 0.968 | | RMSE | 3.601 | 4.561 | 7.836 | 8.623 | 8.863 | 11.357 | 16.157 | 4.701 | | Ours1 | PSNR | 38.384 | 36.299 | 31.572 | 30.802 | 30.500 | 28.401 | 25.286 | 36.031 | | SSIM | 0.963 | 0.927 | 0.958 | 0.908 | 0.880 | 0.914 | 0.759 | 0.97 | | RMSE | 3.693 | 4.692 | 8.268 | 8.802 | 8.995 | 12.295 | 16.173 | 4.881 | | ScSr2[14] | PSNR | 38.205 | 36.083 | 31.158 | 30.571 | 30.377 | 27.796 | 25.277 | 35.762 | | SSIM | 0.961 | 0.921 | 0.955 | 0.903 | 0.876 | 0.903 | 0.757 | 0.969 | | RMSE | 3.651 | 4.652 | 8.108 | 8.776 | 8.986 | 12.282 | 16.167 | 4.834 | | ODL2[17] | PSNR | 38.231 | 36.127 | 31.274 | 30.592 | 30.385 | 27.801 | 25.281 | 35.785 | | SSIM | 0.962 | 0.925 | 0.956 | 0.905 | 0.877 | 0.904 | 0.758 | 0.970 | | RMSE | 3.603 | 4.574 | 7.845 | 8.520 | 8.881 | 11.486 | 16.141 | 4.718 | | Ours2 | PSNR | 38.351 | 36.296 | 31.562 | 30.846 | 30.483 | 28.322 | 25.295 | 35.996 | | SSIM | 0.963 | 0.926 | 0.958 | 0.909 | 0.880 | 0.9127 | 0.759 | 0.971 | | RMSE | 3.751 | 4.801 | 9.309 | 8.982 | 9.385 | 12.963 | 16.179 | 5.479 | | ScSr3[14] | PSNR | 38.080 | 35.887 | 30.043 | 30.415 | 30.134 | 27.206 | 25.283 | 34.791 | | SSIM | 0.960 | 0.923 | 0.942 | 0.901 | 0.874 | 0.895 | 0.758 | 0.966 | | RMSE | 3.707 | 4.768 | 9.235 | 8.966 | 9.220 | 12.944 | 16.154 | 5.406 | | ODL3[17] | PSNR | 38.106 | 35.912 | 30.145 | 30.440 | 30.157 | 27.214 | 25.288 | 34.810 | | SSIM | 0.961 | 0.924 | 0.948 | 0.902 | 0.875 | 0.896 | 0.759 | 0.967 | | RMSE | 3.605 | 4.571 | 7.843 | 8.564 | 8.854 | 11.414 | 16.148 | 4.675 | | Ours3 | PSNR | 38.360 | 36.290 | 31.563 | 30.850 | 30.508 | 28.353 | 25.291 | 36.079 | | SSIM | 0.963 | 0.926 | 0.958 | 0.910 | 0.880 | 0.914 | 0.760 | 0.971 |
|
Table 2. Numerical comparison of reconstruction for different images when the magnification factor is 2
| Method | Evaluation index | Baby | Man | Butterfly | Baboon |
|---|
| RMSE | 5.956 | 13.206 | 18.611 | 20.992 | | Bicubic | PSNR | 33.941 | 27.032 | 24.056 | 23.013 | | SSIM | 0.904 | 0.749 | 0.819 | 0.543 | | RMSE | 6.774 | 14.115 | 19.013 | 22.873 | | NE | PSNR | 30.857 | 23.902 | 21.667 | 21.584 | | SSIM | 0.881 | 0.706 | 0.798 | 0.610 | | RMSE | 5.541 | 12.345 | 15.549 | 20.601 | | ScSr1[14] | PSNR | 34.607 | 27.627 | 25.619 | 23.136 | | SSIM | 0.914 | 0.781 | 0.858 | 0.590 | | RMSE | 5.518 | 12.322 | 15.523 | 20.555 | | ODL1[17] | PSNR | 34.626 | 27.639 | 25.635 | 23.197 | | SSIM | 0.915 | 0.782 | 0.859 | 0.591 | | RMSE | 5.395 | 12.174 | 15.321 | 20.224 | | Ours1 | PSNR | 34.823 | 27.744 | 25.749 | 23.338 | | SSIM | 0.920 | 0.784 | 0.865 | 0.600 | | RMSE | 5.447 | 12.473 | 15.649 | 20.440 | | ScSr2[14] | PSNR | 34.709 | 27.711 | 25.535 | 23.242 | | SSIM | 0.917 | 0.781 | 0.858 | 0.593 | | RMSE | 5.459 | 12.190 | 15.621 | 20.418 | | ODL2[17] | PSNR | 34.720 | 27.732 | 25.579 | 23.255 | | SSIM | 0.916 | 0.782 | 0.859 | 0.594 | | RMSE | 5.395 | 12.104 | 15.501 | 20.224 | | Ours2 | PSNR | 34.823 | 27.793 | 25.648 | 23.338 | | SSIM | 0.920 | 0.784 | 0.863 | 0.600 | | RMSE | 5.577 | 12.202 | 15.700 | 20.663 | | ScS3[14] | PSNR | 34.589 | 27.729 | 25.539 | 23.168 | | SSIM | 0.912 | 0.782 | 0.856 | 0.588 | | RMSE | 5.540 | 12.186 | 15.689 | 20.615 | | ODL3[17] | PSNR | 34.592 | 27.735 | 25.541 | 23.171 | | SSIM | 0.913 | 0.783 | 0.857 | 0.589 | | RMSE | 5.513 | 12.172 | 15.520 | 20.576 | | Ours3 | PSNR | 34.636 | 27.745 | 25.636 | 23.187 | | SSIM | 0.915 | 0.784 | 0.861 | 0.591 |
|
Table 3. Numerical comparison of reconstruction for different images when the magnification factor is 3
| Method | Evaluation index | Baby | Man | Butterfly | Baboon |
|---|
| RMSE | 7.601 | 15.334 | 23.192 | 22.934 | | Bicubic | PSNR | 31.828 | 25.734 | 22.145 | 22.244 | | SSIM | 0.857 | 0.676 | 0.734 | 0.451 | | RMSE | 7.083 | 15.993 | 24.850 | 22.663 | | NE | PSNR | 31.880 | 25.002 | 21.785 | 22.291 | | SSIM | 0.858 | 0.605 | 0.690 | 0.473 | | RMSE | 6.773 | 14.258 | 21.263 | 22.601 | | ScSr1[14] | PSNR | 32.864 | 26.447 | 22.905 | 22.378 | | SSIM | 0.876 | 0.711 | 0.754 | 0.490 | | RMSE | 6.751 | 14.203 | 21.218 | 22.512 | | ODL1[17] | PSNR | 32.872 | 26.450 | 22.919 | 22.407 | | SSIM | 0.877 | 0.712 | 0.755 | 0.491 | | RMSE | 6.735 | 14.109 | 21.040 | 22.497 | | Ours1 | PSNR | 32.893 | 26.462 | 22.992 | 22.413 | | SSIM | 0.878 | 0.713 | 0.757 | 0.492 | | RMSE | 6.747 | 14.488 | 21.091 | 22.552 | | ScSr2[14] | PSNR | 32.859 | 26.239 | 22.970 | 22.009 | | SSIM | 0.876 | 0.705 | 0.755 | 0.490 | | RMSE | 6.756 | 14.464 | 21.084 | 22.521 | | ODL2[17] | PSNR | 32.865 | 26.247 | 22.973 | 22.103 | | SSIM | 0.877 | 0.706 | 0.756 | 0.491 | | RMSE | 6.738 | 14.184 | 21.043 | 22.478 | | Ours2 | PSNR | 32.888 | 26.416 | 22.990 | 22.420 | | SSIM | 0.878 | 0.713 | 0.763 | 0.492 | | RMSE | 6.761 | 14.258 | 21.147 | 22.528 | | ScS3[14] | PSNR | 32.874 | 26.380 | 22.949 | 22.401 | | SSIM | 0.876 | 0.710 | 0.754 | 0.490 | | RMSE | 6.739 | 14.217 | 21.128 | 22.513 | | ODL3[17] | PSNR | 32.886 | 26.396 | 22.956 | 22.407 | | SSIM | 0.877 | 0.711 | 0.755 | 0.491 | | RMSE | 6.681 | 14.195 | 20.963 | 22.371 | | Ours3 | PSNR | 32.962 | 26.409 | 23.025 | 22.462 | | SSIM | 0.880 | 0.713 | 0.763 | 0.495 |
|
Table 4. Comparison of reconstruction for different images when the magnification factor is 4
| Variance | Evaluationindex | Bicubic | NE | ScSr1 | ODL1 | Ours1 | ScSr2 | ODL2 | Ours2 | ScSr3 | ODL3 | Ours3 |
|---|
| RMSE | 5.455 | 12.108 | 4.604 | 4.593 | 4.561 | 4.660 | 4.652 | 4.574 | 4.775 | 4.768 | 4.571 | | 0 | PSNR | 34.713 | 28.669 | 36.231 | 36.239 | 36.299 | 36.119 | 36.127 | 36.276 | 35.907 | 35.912 | 36.280 | | SSIM | 0.911 | 0.788 | 0.925 | 0.926 | 0.927 | 0.924 | 0.925 | 0.926 | 0.923 | 0.924 | 0.926 | | RMSE | 6.942 | 7.001 | 5.903 | 5.889 | 5.727 | 6.386 | 6.377 | 6.244 | 6.597 | 6.584 | 6.261 | | 0.0002 | PSNR | 32.622 | 30.757 | 34.057 | 34.068 | 34.309 | 33.368 | 33.372 | 33.556 | 33.088 | 33.092 | 33.532 | | SSIM | 0.908 | 0874 | 0.928 | 0.929 | 0.932 | 0.883 | 0.884 | 0.885 | 0.882 | 0.883 | 0.886 | | RMSE | 7.480 | 7.992 | 7.490 | 7.477 | 7.465 | 7.583 | 7.542 | 7.487 | 7.731 | 7.695 | 7.463 | | 0.0005 | PSNR | 31.973 | 20.662 | 31.971 | 31.986 | 31.996 | 31.906 | 31.911 | 31.973 | 31.724 | 31.736 | 32.001 | | SSIM | 0.869 | 0.831 | 0.820 | 0.821 | 0.824 | 0.821 | 0.822 | 0.823 | 0.821 | 0.822 | 0.824 |
|
Table 5. Numerical comparison of reconstruction under different Gaussian noise environment
| Density | Evaluationindex | Bicubic | NE | ScSr1 | ODL1 | Ours1 | ScSr2 | ODL2 | Ours2 | ScSr3 | ODL3 | Ours3 |
|---|
| RMSE | 5.455 | 12.108 | 4.697 | 4.593 | 4.561 | 4.673 | 4.652 | 4.574 | 4.787 | 4.768 | 4.571 | | 0 | PSNR | 34.713 | 28.669 | 36.231 | 36.239 | 36.299 | 36.114 | 36.127 | 36.276 | 35.906 | 35.912 | 36.280 | | SSIM | 0.911 | 0.788 | 0.925 | 0.926 | 0.927 | 0.924 | 0.925 | 0.926 | 0.923 | 0.924 | 0.926 | | RMSE | 6.969 | 7.145 | 5.902 | 5.888 | 5.821 | 5.895 | 5.889 | 5.727 | 6.501 | 6.486 | 6.084 | | 0.0005 | PSNR | 32.588 | 32.077 | 34.057 | 34.066 | 34.165 | 34.059 | 34.068 | 34.309 | 33.219 | 33.228 | 33.783 | | SSIM | 0.906 | 0.873 | 0.927 | 0.928 | 0.929 | 0.928 | 0.929 | 0.932 | 0.922 | 0.923 | 0.929 | | RMSE | 7.305 | 7.661 | 6.872 | 6.844 | 6.799 | 7.101 | 7.066 | 6.964 | 7.165 | 7.159 | 6.862 | | 0.001 | PSNR | 32.181 | 31.877 | 32.757 | 32.761 | 32.817 | 32.473 | 32.480 | 32.607 | 32.359 | 32.365 | 32.737 | | SSIM | 0.900 | 0.843 | 0.916 | 0.917 | 0.918 | 0.912 | 0.913 | 0.915 | 0.912 | 0.913 | 0.918 |
|
Table 6. Numerical comparison of reconstruction under different pepper & salt noise environment