
Zhouxiang Wang, Yuchen Xie, Shuangyin Huang, Han Zhou, Rui Liu, Zhifeng Liu, Min Wang, Wenrong Qi, Qianqian Tian, Lingjun Kong, Chenghou Tu, Yongnan Li, Huitian Wang. Propagation characteristics of orbital angular momentum modes at 810 nm in step-index few-mode fibers[J]. Chinese Optics Letters, 2019, 17(12): 120601
- Chinese Optics Letters
- Vol. 17, Issue 12, 120601 (2019)
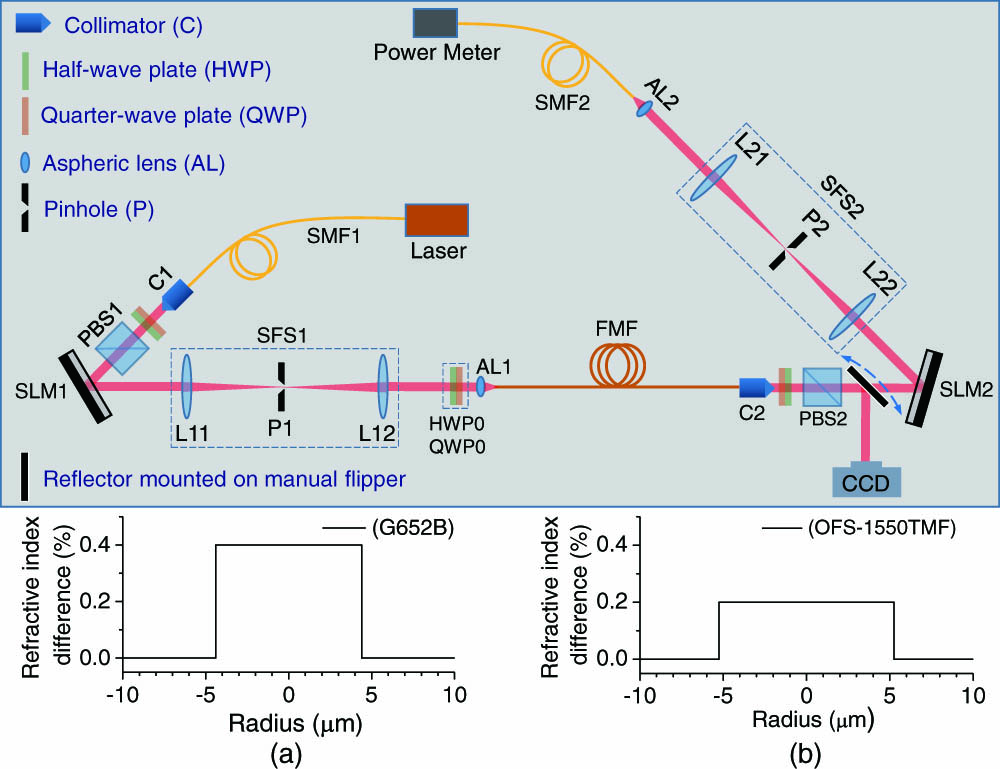
Fig. 1. Diagrammatic sketch of experiment setup. Laser, fs laser at a central wavelength of 810 nm with pulse duration of

Fig. 2. Experimental results of right-handed circularly polarized vortex beams with OAM passing through the G652B fibers with different lengths. (a) From top to bottom, it depicts the holograms loaded on the SLM (from left to right depicts input
Fig. 3. Experimental results of light with OAM passing through OFS-1550TMF optical fibers of 150 m length. The graph is divided into two parts: (a) corresponds to
Fig. 4. OAM spectra of the output beams from the OFS-1550TMF fiber and the encoding results. (a) shows the results of projection measurement for the input beams with

Set citation alerts for the article
Please enter your email address
© Copyright 2018-2021 | Chinese Laser Press. All Rights Reserved 沪ICP备15018463号-20